Industrial Properties
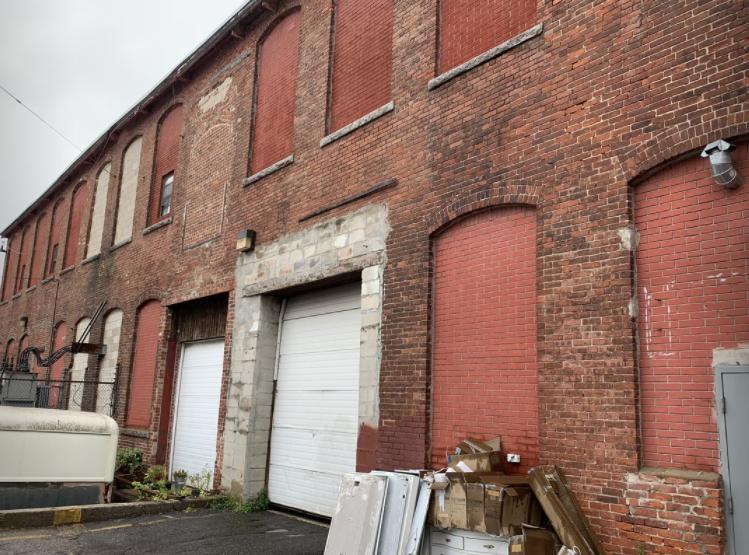
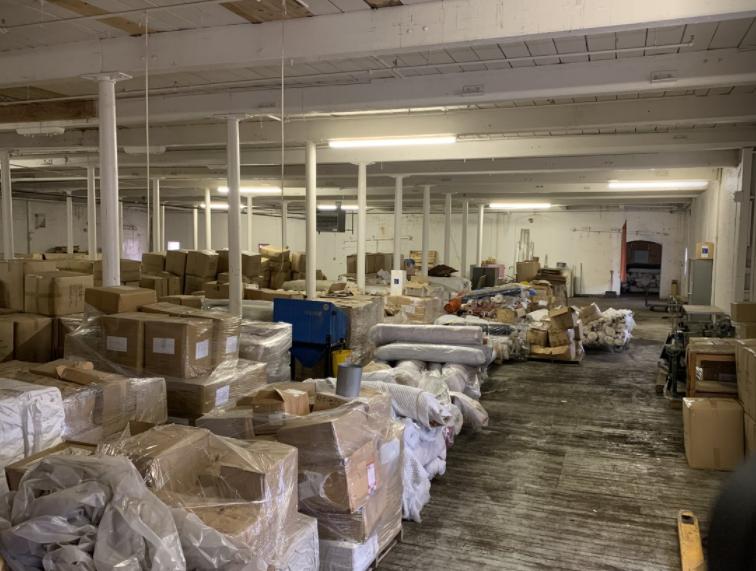
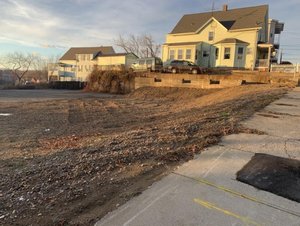
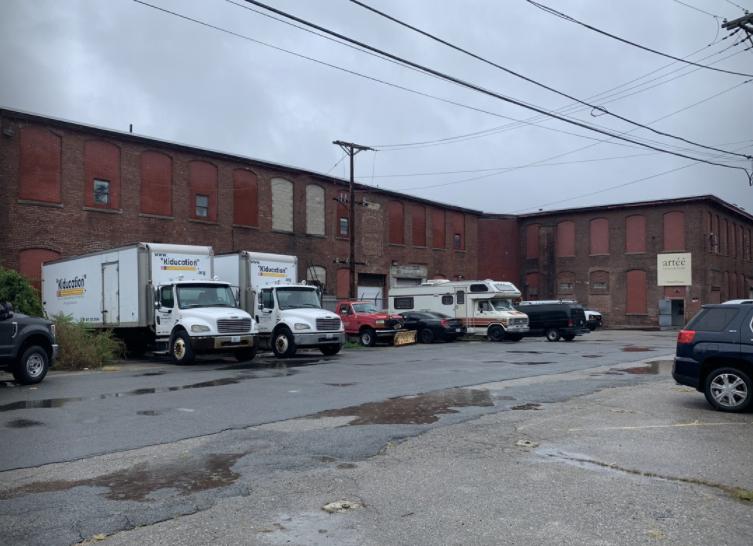
7 Dunnell Lane Pawtucket, RI 02860
7 Dunnell Lane Pawtucket, RI 02860
Details & Description
Listing Agents

Michael Alves
O: 401-523-9555
imcommercial@yahoo.com
O: 401-523-9555
imcommercial@yahoo.com
While we strive to provide the most accurate information, all listing information, and demographic data, is provided by third-parties. As such, MyEListing will not be responsible for the accuracy of the information. It is strongly recommended that you verify all information with the listing agent, and any relevant agencies, prior to making any decisions.