Description
Five tax lots being combined into one (1) - .87 acre development parcel just south of the hospital and in a growing area of medical development. This is the best medical development parcel in Salem as it has preliminary drawings and engineering for a two-story, 16,200 sq. ft. office building with 72 onsite parking spaces. That ratio of 4.4 per 1,000 SF is outstanding for medical.
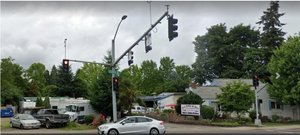
This site is located less than one mile from the local hospital and is very close to downtown Salem and very convenient to I-5. The site is flat with all utilities in the street.
Highlights
87 acres of Industrial Commercial (IC) zoned land
Commercial office, retail and light industrial uses allowed
Preliminary design for a 16,200 SF office with 72 parking spaces
Surrounding businesses include Silver Falls Dermatology, Cherry City Interiors, and Salem Pediatric.
No part of this information may be copied, reproduced, repurposed, or screen-captured for any commercial purpose without prior written authorization from MyEListing.
While we strive to provide the most accurate information, all listing information, and demographic data, is provided by third-parties. As such, MyEListing will not be responsible for the accuracy of the information. It is strongly recommended that you verify all information with the listing agent, and any relevant agencies, prior to making any decisions.
What is the asking price for 1740 13th Street Southeast in Salem?
The asking price for 1740 13th Street Southeast is $572,865
How much land does the Salem, OR property at 1740 13th Street Southeast include?
1740 13th Street Southeast in Salem includes 0.870 acres of land
What kind of Land is the propery at 1740 13th Street Southeast?
The property at 1740 13th Street Southeast Salem, OR 97302 is listed as a Mixed Use Land Land property
What is the population within 1 mile of 1740 13th Street Southeast in Salem?
The population within 1 mile of 1740 13th Street Southeast Salem, OR 97302 is 12,046 people.
Who do I contact for questions about 1740 13th Street Southeast?
You should contact the listing agent,
Curt Arthur, for any details regarding this commercial listing.