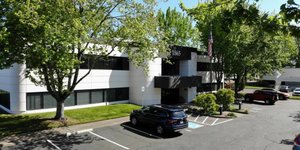
1-Mile | 3-Miles | 5-Miles | ||
---|---|---|---|---|
Total Population | 17,090 | 127,377 | 305,069 | |
Population Median Age | 38 | 37 | 37 | |
Population by Age | 0-9 Yrs | 2030 (11%) | 15999 (12%) | 37294 (12%) |
10-19 Yrs | 2187 (12%) | 16109 (12%) | 38030 (12%) | |
20-29 Yrs | 2287 (13%) | 17854 (14%) | 42140 (13%) | |
30-39 Yrs | 2720 (15%) | 20011 (15%) | 50203 (16%) | |
40-49 Yrs | 2344 (13%) | 18986 (14%) | 43599 (14%) | |
50-59 Yrs | 2420 (14%) | 16710 (13%) | 38227 (12%) | |
60-69 Yrs | 1809 (10%) | 11817 (9%) | 30737 (10%) | |
70+ Yrs | 1292 (7%) | 9892 (7%) | 24839 (8%) | |
Median HH Income | $80,518 | $88,685 | $85,671 | |
Total Household Income | < 24K | 700 (10%) | 5360 (10%) | 13222 (11%) |
25-49K | 1360 (19%) | 8260 (16%) | 19345 (16%) | |
50-74K | 1200 (17%) | 7134 (14%) | 18696 (16%) | |
75-99K | 866 (12%) | 6848 (13%) | 16384 (14%) | |
100-199K | 1980 (28%) | 13560 (27%) | 33177 (28%) | |
200K+ | 797 (11%) | 7844 (16%) | 15690 (13%) | |
Highest Education Level | No Diploma | 534 | 5743 | 14027 |
Diploma or GED | 1589 | 10924 | 30699 | |
Some College | 2480 | 14833 | 39879 | |
Assoc. Degree | 1087 | 7168 | 17733 | |
Bachelors Degree | 3901 | 27565 | 64136 | |
Higher Degree | 2425 | 21604 | 45395 | |
Total Housing Units | 7,217 | 51,382 | 122,225 | |
--Owner-Occupied | 3,825 | 27,654 | 68,401 | |
--Renter-Occupied | 3,078 | 21,352 | 48,113 | |
Owner-Occupied Values | < 100K | 65 | 770 | 1887 |
100-199K | 311 | 1158 | 2748 | |
200-299K | 485 | 3102 | 9955 | |
300-399K | 933 | 5540 | 17108 | |
400-499K | 741 | 5164 | 13197 | |
500K+ | 1290 | 11921 | 23505 | |
Total Working Age Population | 13,544 | 100,882 | 243,774 | |
In Work Force | 9,728 | 71,400 | 170,372 | |
Not In Work Force | 3,816 | 29,482 | 73,402 | |
Workforce Employed | 9,188 | 68,436 | 162,364 | |
Workforce Unemployed | 539 | 2,964 | 7,718 | |
Civlian Workforce | 9,728 | 71,400 | 170,082 | |
Military Workforce | 0 | 0 | 290 | |
Total Households | 6,902 | 49,006 | 116,513 | |
Family Households | 4,310 | 31,965 | 75,942 | |
Non-Family Households | 2,592 | 17,041 | 40,571 | |
Married Couple | 3,274 | 25,753 | 60,959 | |
Other Family | 1,035 | 6,212 | 14,983 | |
Married w/Child | 1,504 | 12,096 | 27,888 | |
Single Male w/Child | 156 | 879 | 2,286 | |
Single Female w/Child | 521 | 2,801 | 5,807 |
Population Change Last Two Decades - Plus Projection
2000 | % | 2010 | % | 2020 | % | 2030 | |
---|---|---|---|---|---|---|---|
Oregon | 3,421,399 | +12 | 3,831,074 | +11 | 4,264,810 | +11 | 4,727,438 |
Clackamas County | 338,391 | +11 | 375,992 | +14 | 428,860 | +14 | 490,011 |
Multnomah County | 660,486 | +11 | 735,334 | +12 | 822,675 | +10 | 906,904 |
Washington County | 445,342 | +19 | 529,710 | +17 | 619,337 | +16 | 718,633 |
Washington | 5,894,121 | +14 | 6,724,540 | +14 | 7,638,415 | +11 | 8,503,178 |
Clark County | 345,238 | +23 | 425,363 | +17 | 499,400 | +16 | 576,879 |
Total Working Age Population:
Total Households:
Total Working Age Population:
Total Households:
Total Working Age Population:
Total Households: