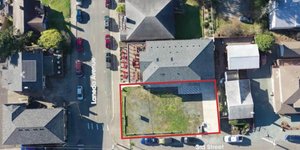
Location
Centrally located within the City of
Portland, this property is in a prime
commerical area. With quick access to
I-84, I-5, Central Eastside, and Downtown
Portland, the neighborhood is already a
hotbed of activity
Description
Located in opportunity zone
Property Taxes: $64,049.55
Zoning: CS
Year built: 1920
Construction type: Poured in place concrete type III B
Loading: One grade door
No part of this information may be copied, reproduced, repurposed, or screen-captured for any commercial purpose without prior written authorization from MyEListing.
While we strive to provide the most accurate information, all listing information, and demographic data, is provided by third-parties. As such, MyEListing will not be responsible for the accuracy of the information. It is strongly recommended that you verify all information with the listing agent, and any relevant agencies, prior to making any decisions.
What is the building size of this Retail property in Portland, OR?
The size of the building/unit at 1931 Northeast Sandy Boulevard in Portland is 38,776 square feet
How much land does the Portland, OR property at 1931 Northeast Sandy Boulevard include?
1931 Northeast Sandy Boulevard in Portland includes 1.000 acres of land
What kind of Retail is the propery at 1931 Northeast Sandy Boulevard?
The property at 1931 Northeast Sandy Boulevard Portland, OR 97232 is listed as a Free Standing Building Retail property
What is the population within 1 mile of 1931 Northeast Sandy Boulevard in Portland?
The population within 1 mile of 1931 Northeast Sandy Boulevard Portland, OR 97232 is 29,304 people.
Who do I contact for questions about 1931 Northeast Sandy Boulevard?
You should contact the listing agent,
Brett Bayne, for any details regarding this commercial listing.