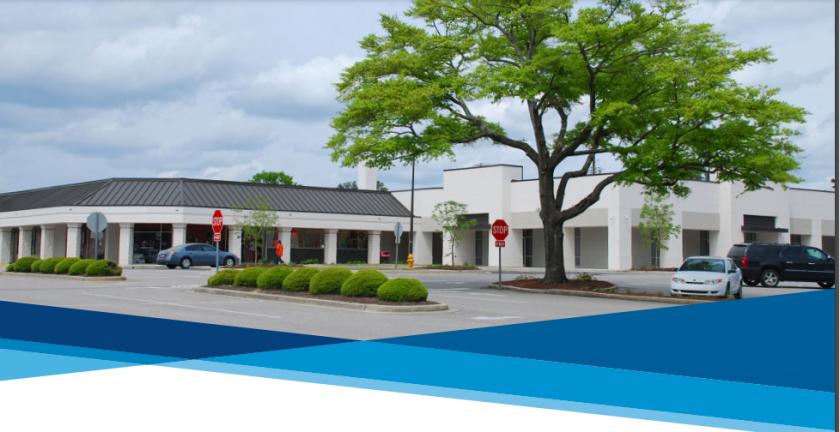
1-Mile | 3-Miles | 5-Miles | ||
---|---|---|---|---|
Total Population | 9,069 | 63,828 | 146,244 | |
Population Median Age | 36 | 35 | 37 | |
Population by Age | 0-9 Yrs | 373 (4%) | 4308 (6%) | 13709 (9%) |
10-19 Yrs | 1139 (12%) | 11573 (18%) | 20480 (14%) | |
20-29 Yrs | 3664 (40%) | 19058 (29%) | 36621 (25%) | |
30-39 Yrs | 1040 (11%) | 7531 (11%) | 18121 (12%) | |
40-49 Yrs | 504 (5%) | 4680 (7%) | 13427 (9%) | |
50-59 Yrs | 674 (7%) | 5856 (9%) | 15523 (10%) | |
60-69 Yrs | 856 (9%) | 5578 (8%) | 14891 (10%) | |
70+ Yrs | 820 (9%) | 5243 (8%) | 13472 (9%) | |
Median HH Income | $42,122 | $42,137 | $42,739 | |
Total Household Income | < 24K | 1481 (34%) | 8388 (32%) | 19036 (30%) |
25-49K | 938 (21%) | 6481 (24%) | 16056 (25%) | |
50-74K | 644 (15%) | 4108 (15%) | 10290 (16%) | |
75-99K | 523 (12%) | 2886 (11%) | 6404 (10%) | |
100-199K | 518 (12%) | 3225 (12%) | 7870 (12%) | |
200K+ | 181 (4%) | 1058 (4%) | 2676 (4%) | |
Highest Education Level | No Diploma | 441 | 3629 | 9449 |
Diploma or GED | 817 | 7739 | 21096 | |
Some College | 965 | 7342 | 18921 | |
Assoc. Degree | 436 | 2755 | 6548 | |
Bachelors Degree | 1403 | 8062 | 20102 | |
Higher Degree | 986 | 6300 | 14728 | |
Total Housing Units | 4,934 | 30,689 | 72,659 | |
--Owner-Occupied | 1,208 | 10,363 | 28,310 | |
--Renter-Occupied | 3,078 | 15,784 | 34,021 | |
Owner-Occupied Values | < 100K | 191 | 2713 | 7379 |
100-199K | 735 | 4872 | 12252 | |
200-299K | 106 | 1299 | 3916 | |
300-399K | 103 | 739 | 2106 | |
400-499K | 25 | 343 | 1067 | |
500K+ | 47 | 396 | 1591 | |
Total Working Age Population | 8,540 | 57,475 | 125,469 | |
In Work Force | 5,518 | 34,126 | 78,550 | |
Not In Work Force | 3,022 | 23,349 | 46,919 | |
Workforce Employed | 5,131 | 32,077 | 73,117 | |
Workforce Unemployed | 371 | 1,930 | 5,122 | |
Civlian Workforce | 5,502 | 34,007 | 78,239 | |
Military Workforce | 16 | 119 | 311 | |
Total Households | 4,286 | 26,147 | 62,332 | |
Family Households | 1,098 | 9,786 | 27,699 | |
Non-Family Households | 3,188 | 16,361 | 34,633 | |
Married Couple | 656 | 6,120 | 16,072 | |
Other Family | 441 | 3,667 | 11,627 | |
Married w/Child | 148 | 1,771 | 5,248 | |
Single Male w/Child | 16 | 280 | 888 | |
Single Female w/Child | 162 | 1,396 | 4,750 |
Population Change Last Two Decades - Plus Projection
2000 | % | 2010 | % | 2020 | % | 2030 | |
---|---|---|---|---|---|---|---|
South Carolina | 4,012,012 | +15 | 4,625,364 | +9 | 5,020,400 | +9 | 5,488,460 |
Lexington County | 216,014 | +21 | 262,391 | +12 | 294,510 | +13 | 333,180 |
Richland County | 320,677 | +20 | 384,504 | +3 | 395,920 | +8 | 425,960 |
Total Working Age Population:
Total Households:
Total Working Age Population:
Total Households:
Total Working Age Population:
Total Households: