Industrial Properties
435 East Shockley Ferry Road Anderson, SC 29624
435 East Shockley Ferry Road Anderson, SC 29624
Details & Description
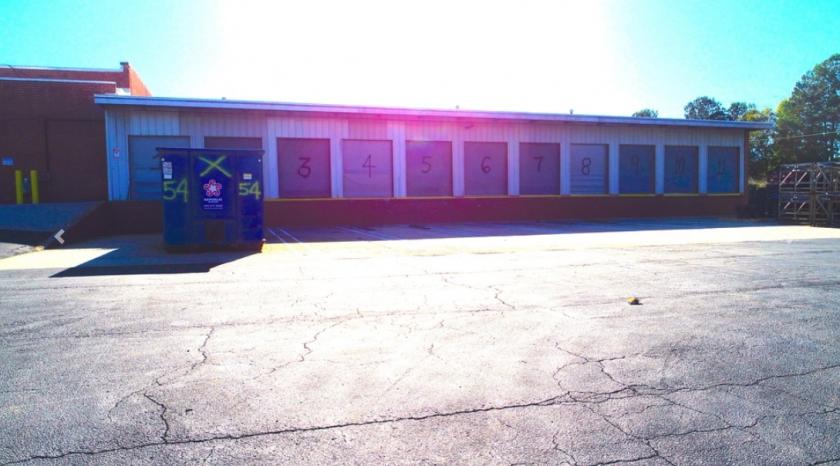
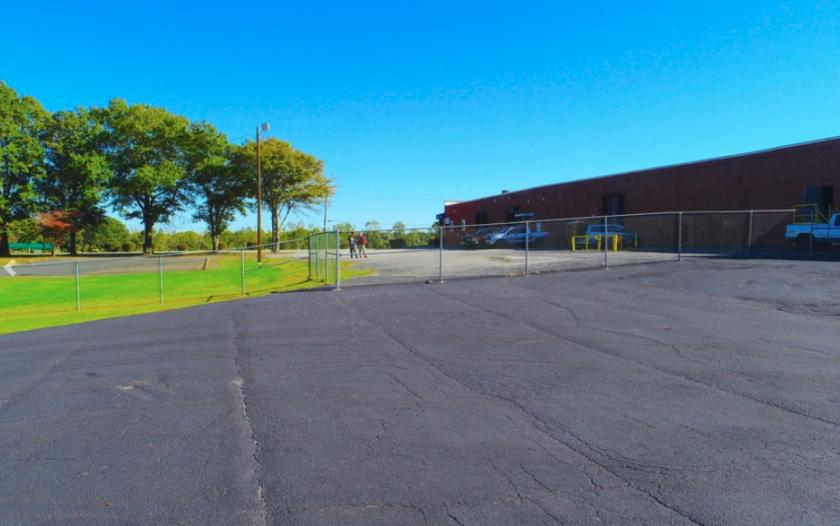
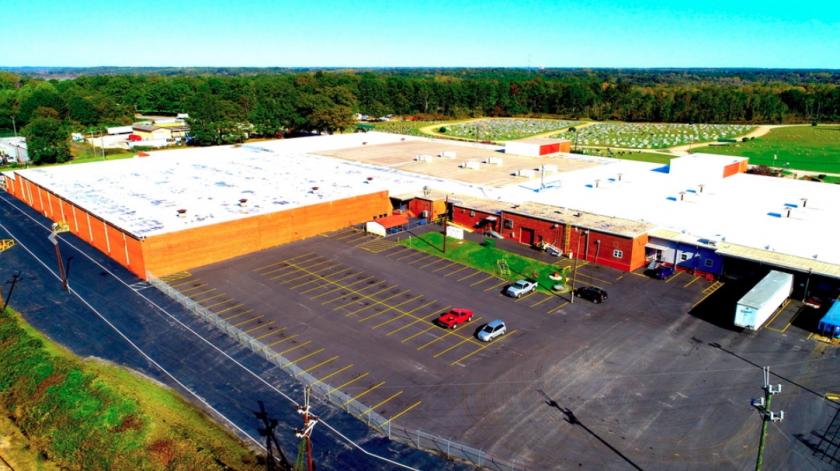
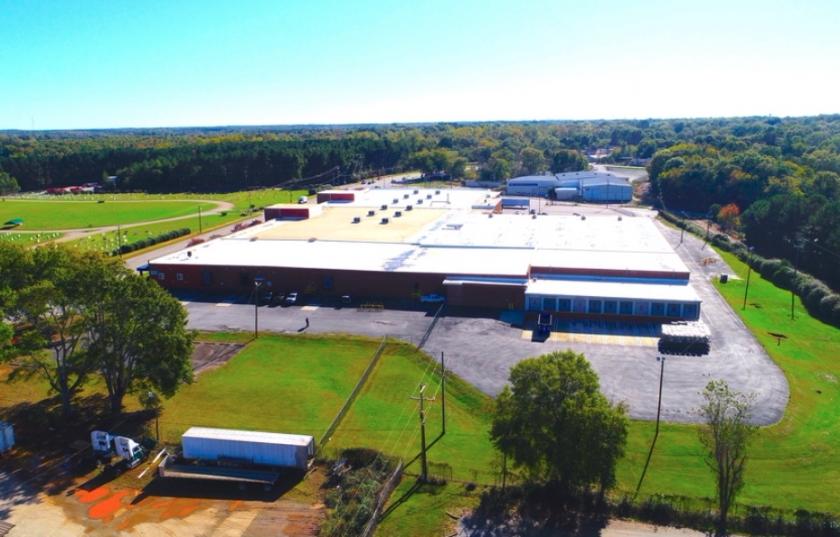
Additional Photos

Listing Agents

Mark Dzulynsky
O: 954-248-3073
mark.dzulynsky@svn.com
O: 954-248-3073
mark.dzulynsky@svn.com
While we strive to provide the most accurate information, all listing information, and demographic data, is provided by third-parties. As such, MyEListing will not be responsible for the accuracy of the information. It is strongly recommended that you verify all information with the listing agent, and any relevant agencies, prior to making any decisions.


