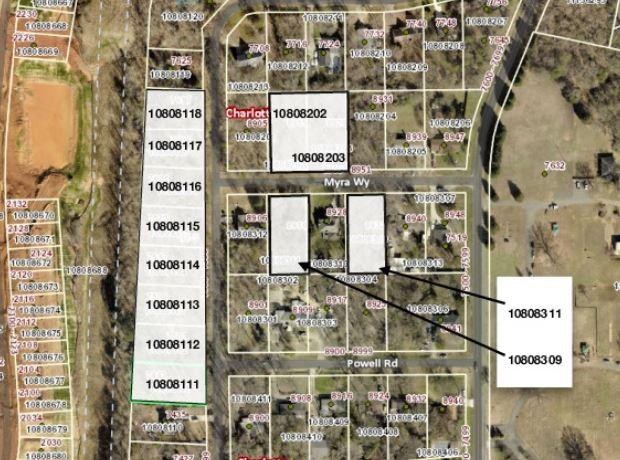
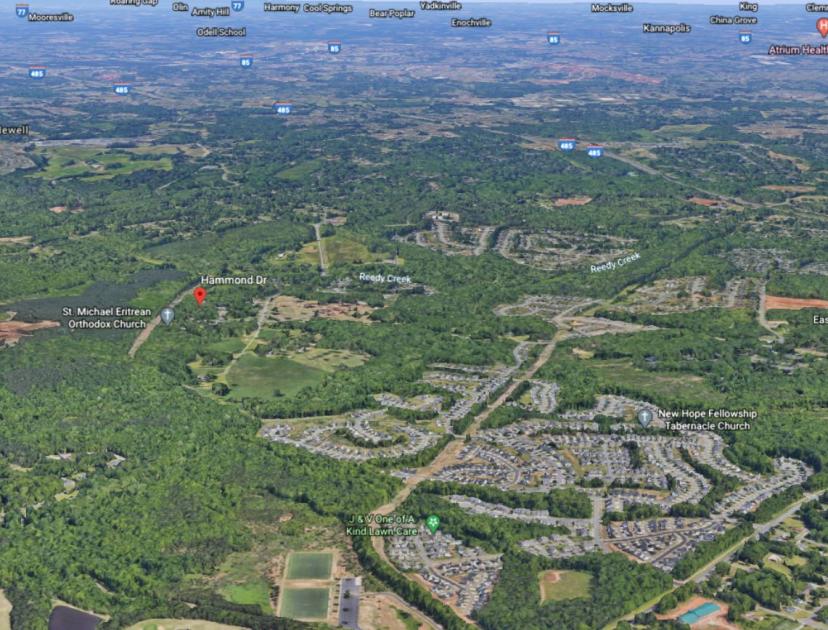
1-Mile | 3-Miles | 5-Miles | ||
---|---|---|---|---|
Total Population | 4,083 | 58,706 | 191,845 | |
Population Median Age | 32 | 34 | 34 | |
Population by Age | 0-9 Yrs | 633 (15%) | 9205 (15%) | 27569 (14%) |
10-19 Yrs | 699 (17%) | 9367 (15%) | 29755 (15%) | |
20-29 Yrs | 614 (15%) | 8191 (13%) | 31397 (16%) | |
30-39 Yrs | 562 (13%) | 8892 (15%) | 28024 (14%) | |
40-49 Yrs | 716 (17%) | 8364 (14%) | 26632 (13%) | |
50-59 Yrs | 478 (11%) | 6834 (11%) | 21633 (11%) | |
60-69 Yrs | 234 (5%) | 4730 (8%) | 15110 (7%) | |
70+ Yrs | 148 (3%) | 3122 (5%) | 11725 (6%) | |
Median HH Income | $55,246 | $56,379 | $50,781 | |
Total Household Income | < 24K | 199 (15%) | 3129 (16%) | 13058 (20%) |
25-49K | 407 (31%) | 5228 (27%) | 18933 (29%) | |
50-74K | 226 (17%) | 4009 (20%) | 12812 (19%) | |
75-99K | 209 (15%) | 2664 (13%) | 7844 (12%) | |
100-199K | 235 (17%) | 3543 (18%) | 10304 (15%) | |
200K+ | 33 (2%) | 646 (3%) | 2059 (3%) | |
Highest Education Level | No Diploma | 258 | 4974 | 20501 |
Diploma or GED | 600 | 9248 | 28135 | |
Some College | 585 | 8540 | 27332 | |
Assoc. Degree | 210 | 2944 | 10127 | |
Bachelors Degree | 497 | 7131 | 22776 | |
Higher Degree | 260 | 3101 | 10070 | |
Total Housing Units | 1,358 | 20,564 | 69,732 | |
--Owner-Occupied | 931 | 12,380 | 35,431 | |
--Renter-Occupied | 377 | 6,839 | 29,580 | |
Owner-Occupied Values | < 100K | 43 | 1453 | 5083 |
100-199K | 668 | 7210 | 18476 | |
200-299K | 175 | 2674 | 7592 | |
300-399K | 32 | 676 | 2778 | |
400-499K | 12 | 199 | 808 | |
500K+ | 1 | 169 | 694 | |
Total Working Age Population | 3,022 | 44,032 | 148,123 | |
In Work Force | 2,283 | 31,209 | 103,362 | |
Not In Work Force | 739 | 12,823 | 44,760 | |
Workforce Employed | 2,128 | 28,793 | 96,779 | |
Workforce Unemployed | 155 | 2,390 | 6,504 | |
Civlian Workforce | 2,283 | 31,183 | 103,283 | |
Military Workforce | 0 | 26 | 79 | |
Total Households | 1,308 | 19,219 | 65,011 | |
Family Households | 891 | 13,665 | 42,142 | |
Non-Family Households | 417 | 5,554 | 22,869 | |
Married Couple | 540 | 8,585 | 26,000 | |
Other Family | 351 | 5,080 | 16,142 | |
Married w/Child | 296 | 3,884 | 11,675 | |
Single Male w/Child | 56 | 725 | 2,301 | |
Single Female w/Child | 170 | 2,381 | 7,019 |
Population Change Last Two Decades - Plus Projection
2000 | % | 2010 | % | 2020 | % | 2030 | |
---|---|---|---|---|---|---|---|
North Carolina | 8,049,313 | +18 | 9,535,483 | +11 | 10,630,691 | +11 | 11,836,070 |
Cabarrus County | 131,063 | +36 | 178,011 | +22 | 216,608 | +20 | 259,075 |
Mecklenburg County | 695,454 | +32 | 919,628 | +23 | 1,131,342 | +19 | 1,348,822 |
Total Working Age Population:
Total Households:
Total Working Age Population:
Total Households:
Total Working Age Population:
Total Households: