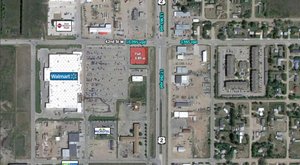
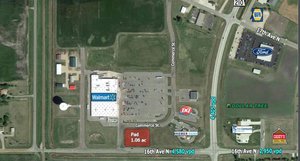
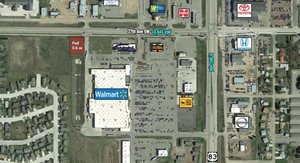
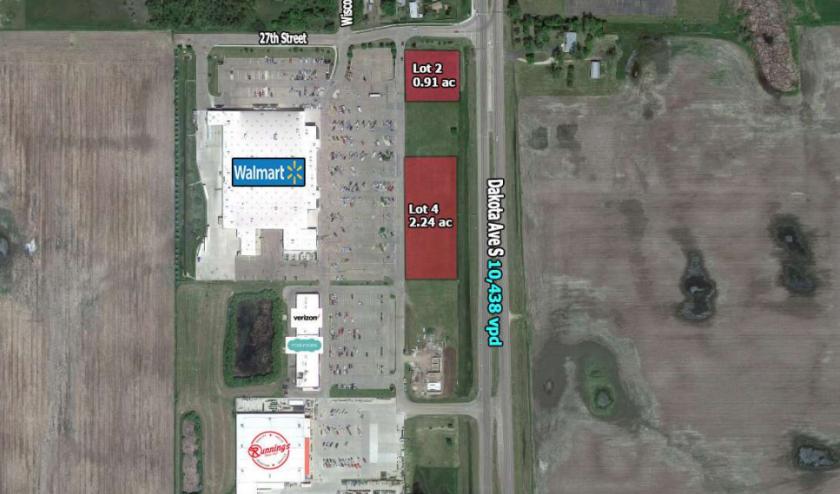
1-Mile | 3-Miles | 5-Miles | ||
---|---|---|---|---|
Total Population | 808 | 11,333 | 13,663 | |
Population Median Age | 43 | 38 | 38 | |
Population by Age | 0-9 Yrs | 88 (10%) | 1954 (17%) | 2322 (16%) |
10-19 Yrs | 81 (10%) | 1482 (13%) | 1724 (12%) | |
20-29 Yrs | 129 (15%) | 1435 (12%) | 1789 (13%) | |
30-39 Yrs | 90 (11%) | 1309 (11%) | 1551 (11%) | |
40-49 Yrs | 81 (10%) | 1313 (11%) | 1554 (11%) | |
50-59 Yrs | 77 (9%) | 1133 (9%) | 1418 (10%) | |
60-69 Yrs | 110 (13%) | 1296 (11%) | 1606 (11%) | |
70+ Yrs | 151 (18%) | 1410 (12%) | 1699 (12%) | |
Median HH Income | $48,204 | $46,495 | $47,751 | |
Total Household Income | < 24K | 66 (17%) | 1052 (22%) | 1177 (20%) |
25-49K | 130 (34%) | 1521 (32%) | 1823 (32%) | |
50-74K | 50 (13%) | 903 (19%) | 1089 (19%) | |
75-99K | 49 (13%) | 557 (11%) | 665 (11%) | |
100-199K | 67 (17%) | 602 (12%) | 765 (13%) | |
200K+ | 12 (3%) | 86 (1%) | 134 (2%) | |
Highest Education Level | No Diploma | 50 | 1296 | 1593 |
Diploma or GED | 174 | 2405 | 2921 | |
Some College | 180 | 1533 | 1772 | |
Assoc. Degree | 41 | 710 | 872 | |
Bachelors Degree | 68 | 872 | 1129 | |
Higher Degree | 67 | 516 | 597 | |
Total Housing Units | 418 | 5,166 | 6,227 | |
--Owner-Occupied | 200 | 2,846 | 3,428 | |
--Renter-Occupied | 174 | 1,876 | 2,226 | |
Owner-Occupied Values | < 100K | 41 | 1516 | 1727 |
100-199K | 114 | 986 | 1171 | |
200-299K | 28 | 184 | 281 | |
300-399K | 11 | 81 | 131 | |
400-499K | 6 | 40 | 63 | |
500K+ | 0 | 39 | 56 | |
Total Working Age Population | 674 | 8,435 | 10,244 | |
In Work Force | 451 | 5,540 | 6,695 | |
Not In Work Force | 223 | 2,895 | 3,549 | |
Workforce Employed | 448 | 5,450 | 6,590 | |
Workforce Unemployed | 3 | 91 | 105 | |
Civlian Workforce | 451 | 5,540 | 6,695 | |
Military Workforce | 0 | 0 | 0 | |
Total Households | 374 | 4,722 | 5,654 | |
Family Households | 194 | 2,673 | 3,259 | |
Non-Family Households | 179 | 2,049 | 2,396 | |
Married Couple | 156 | 1,901 | 2,380 | |
Other Family | 38 | 772 | 878 | |
Married w/Child | 60 | 911 | 1,159 | |
Single Male w/Child | 4 | 152 | 184 | |
Single Female w/Child | 28 | 364 | 407 |
Population Change Last Two Decades - Plus Projection
2000 | % | 2010 | % | 2020 | % | 2030 | |
---|---|---|---|---|---|---|---|
South Dakota | 754,844 | +8 | 814,180 | +9 | 889,447 | +7 | 951,885 |
Beadle County | 17,023 | +2 | 17,398 | +2 | 17,739 | +1 | 17,919 |
Total Working Age Population:
Total Households:
Total Working Age Population:
Total Households:
Total Working Age Population:
Total Households: