Retail Space
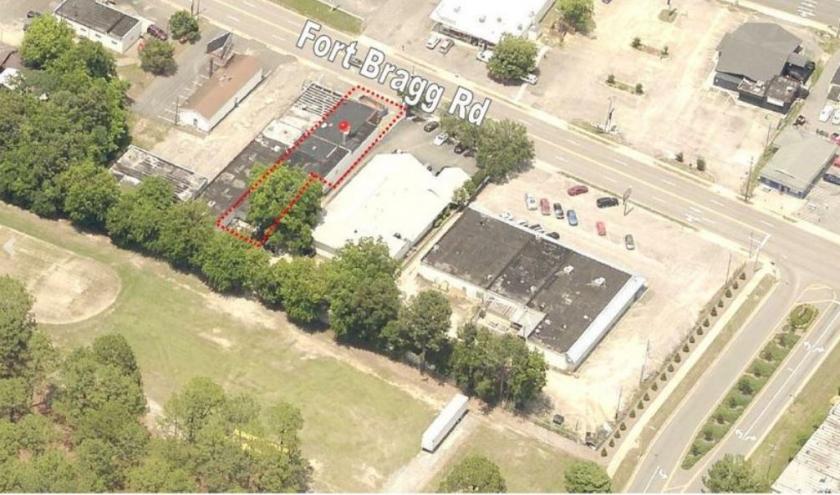
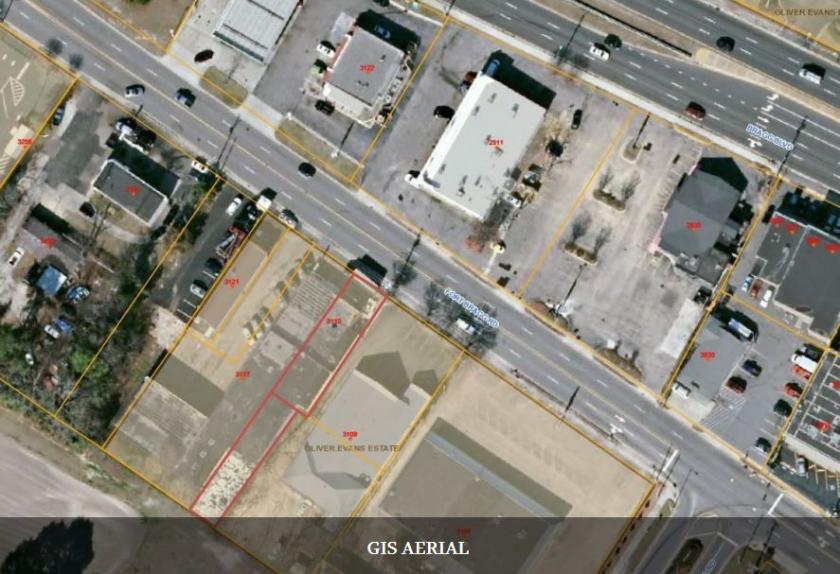
3115 Fort Bragg Road Fayetteville, NC 28303
3115 Fort Bragg Road Fayetteville, NC 28303
Details & Description
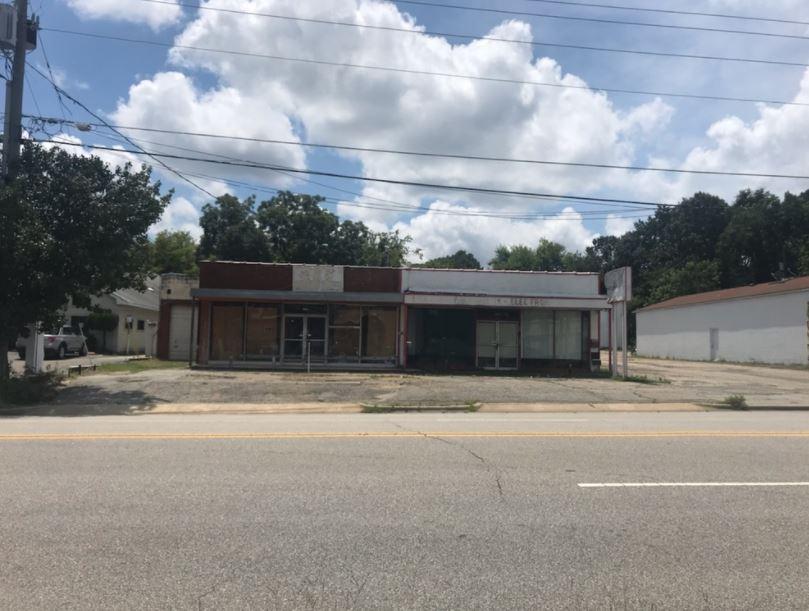
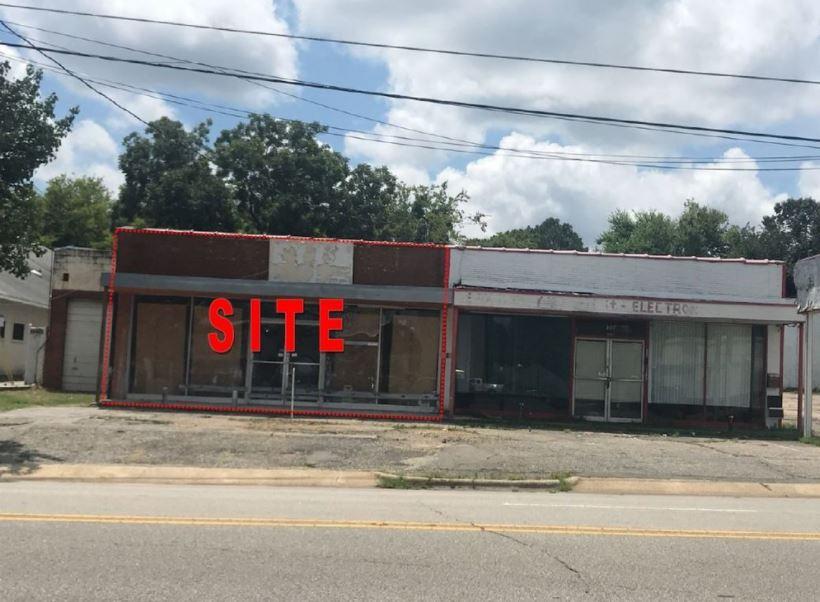
Additional Photos
Listing Agents

Susan Evans
O: 910-829-1617
M: 919-920-2140
susan@grantmurrayre.com
O: 910-829-1617
M: 919-920-2140
susan@grantmurrayre.com
While we strive to provide the most accurate information, all listing information, and demographic data, is provided by third-parties. As such, MyEListing will not be responsible for the accuracy of the information. It is strongly recommended that you verify all information with the listing agent, and any relevant agencies, prior to making any decisions.


