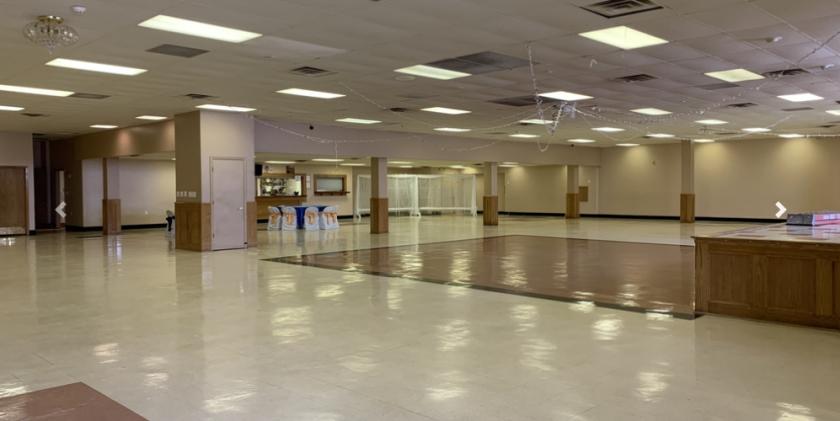
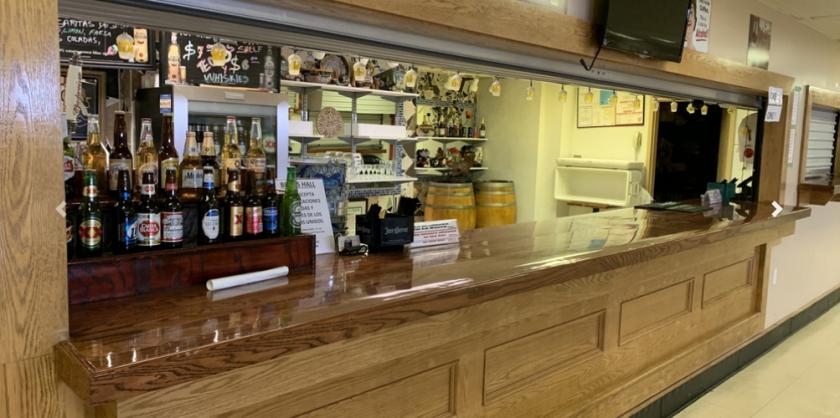
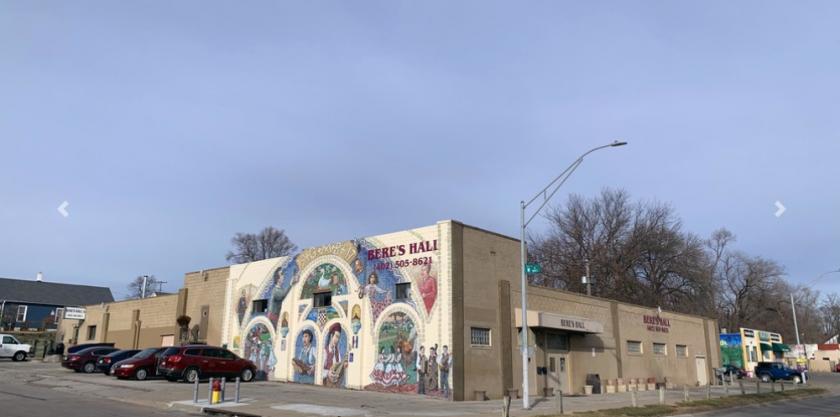
1-Mile | 3-Miles | 5-Miles | ||
---|---|---|---|---|
Total Population | 16,605 | 86,410 | 233,175 | |
Population Median Age | 32 | 34 | 35 | |
Population by Age | 0-9 Yrs | 3037 (18%) | 14444 (16%) | 32638 (13%) |
10-19 Yrs | 2950 (17%) | 13144 (15%) | 31667 (13%) | |
20-29 Yrs | 2570 (15%) | 13433 (15%) | 42442 (18%) | |
30-39 Yrs | 2461 (14%) | 12067 (13%) | 34275 (14%) | |
40-49 Yrs | 1673 (10%) | 9845 (11%) | 25415 (10%) | |
50-59 Yrs | 1654 (9%) | 10327 (11%) | 27053 (11%) | |
60-69 Yrs | 1141 (6%) | 7072 (8%) | 20970 (8%) | |
70+ Yrs | 1118 (6%) | 6077 (7%) | 18714 (8%) | |
Median HH Income | $42,334 | $51,942 | $55,874 | |
Total Household Income | < 24K | 1407 (26%) | 6312 (21%) | 18615 (20%) |
25-49K | 1641 (31%) | 8127 (27%) | 21998 (24%) | |
50-74K | 1158 (22%) | 6271 (20%) | 17491 (19%) | |
75-99K | 563 (10%) | 4071 (13%) | 12392 (13%) | |
100-199K | 475 (9%) | 4657 (15%) | 16408 (18%) | |
200K+ | 10 (0%) | 600 (1%) | 3306 (3%) | |
Highest Education Level | No Diploma | 3188 | 12253 | 21249 |
Diploma or GED | 3021 | 16095 | 37869 | |
Some College | 1906 | 10806 | 31371 | |
Assoc. Degree | 621 | 3653 | 11563 | |
Bachelors Degree | 582 | 6471 | 28949 | |
Higher Degree | 251 | 2891 | 16798 | |
Total Housing Units | 5,652 | 32,001 | 97,556 | |
--Owner-Occupied | 3,296 | 18,999 | 48,296 | |
--Renter-Occupied | 1,958 | 11,038 | 41,914 | |
Owner-Occupied Values | < 100K | 1436 | 6189 | 10392 |
100-199K | 1770 | 10901 | 26142 | |
200-299K | 72 | 1363 | 7743 | |
300-399K | 2 | 289 | 2262 | |
400-499K | 7 | 94 | 701 | |
500K+ | 9 | 163 | 1056 | |
Total Working Age Population | 11,740 | 63,850 | 182,690 | |
In Work Force | 7,947 | 44,494 | 127,293 | |
Not In Work Force | 3,794 | 19,356 | 55,397 | |
Workforce Employed | 7,316 | 41,646 | 119,677 | |
Workforce Unemployed | 630 | 2,471 | 5,929 | |
Civlian Workforce | 7,946 | 44,117 | 125,607 | |
Military Workforce | 1 | 377 | 1,686 | |
Total Households | 5,253 | 30,037 | 90,210 | |
Family Households | 3,572 | 19,809 | 51,572 | |
Non-Family Households | 1,681 | 10,228 | 38,637 | |
Married Couple | 2,054 | 13,193 | 36,535 | |
Other Family | 1,519 | 6,616 | 15,037 | |
Married w/Child | 1,050 | 6,359 | 16,141 | |
Single Male w/Child | 113 | 974 | 2,177 | |
Single Female w/Child | 595 | 2,759 | 6,600 |
Population Change Last Two Decades - Plus Projection
2000 | % | 2010 | % | 2020 | % | 2030 | |
---|---|---|---|---|---|---|---|
Iowa | 2,926,324 | +4 | 3,046,355 | -100 | |||
Pottawattamie County | 87,704 | +6 | 93,158 | -100 | |||
Nebraska | 1,711,263 | +7 | 1,826,341 | +6 | 1,943,452 | +6 | 2,053,788 |
Douglas County | 463,585 | +12 | 517,110 | +10 | 571,311 | +9 | 625,173 |
Sarpy County | 122,595 | +30 | 158,840 | +24 | 196,701 | +19 | 233,688 |
Total Working Age Population:
Total Households:
Total Working Age Population:
Total Households:
Total Working Age Population:
Total Households: