Industrial Properties
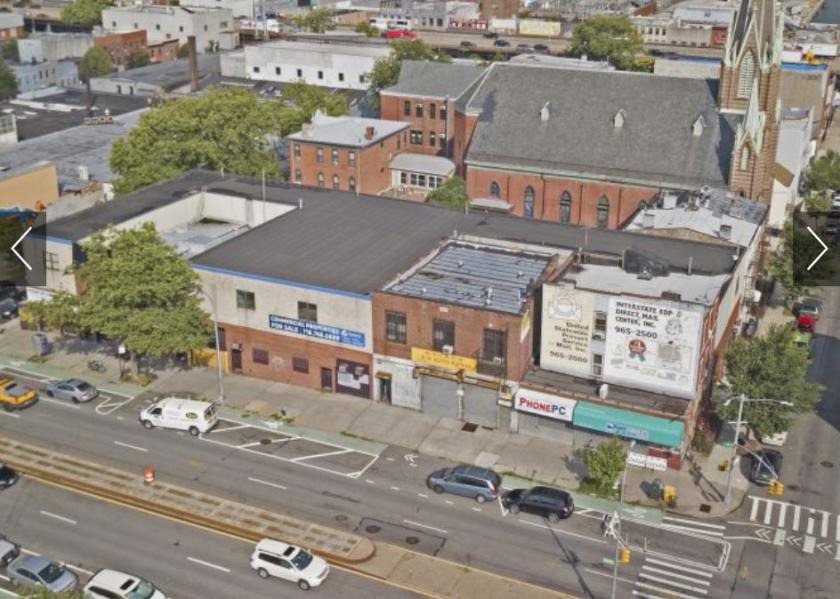
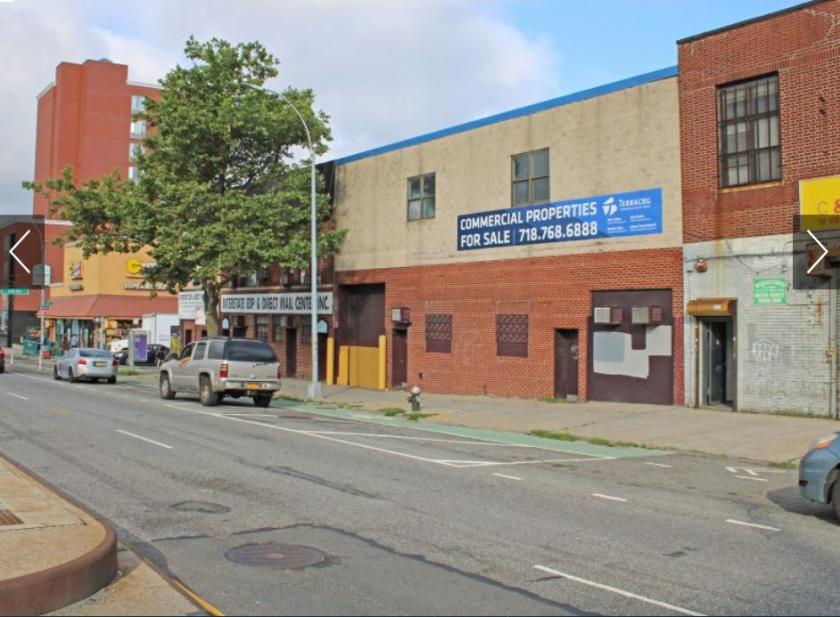
750 4th Avenue Brooklyn, NY 11232
750 4th Avenue Brooklyn, NY 11232
Details & Description
Additional Photos


Listing Agents

Adam Tannenbaum
O: 718-489-8333
atannenbaum@terracrg.com
O: 718-489-8333
atannenbaum@terracrg.com
While we strive to provide the most accurate information, all listing information, and demographic data, is provided by third-parties. As such, MyEListing will not be responsible for the accuracy of the information. It is strongly recommended that you verify all information with the listing agent, and any relevant agencies, prior to making any decisions.


