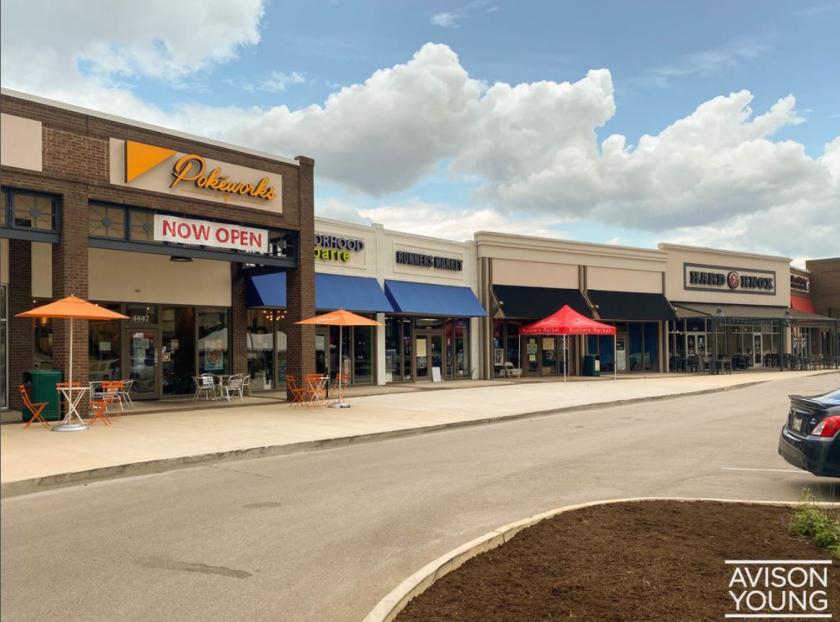
Western Plaza is a Knoxville retail destination: grocery-anchored with a pharmacy, clothing boutiques, and popular restaurants. The current redevelopment also includes Knoxville’s newest office building and an aggressive tenant improvement allowance for existing retail space. Parking lot renovations are well underway to increase the walkability of the center.Western Plaza receives a healthy buzz of consumer activity with well-known tenants including The Fresh Market, Hard Knox Pizza, CVS, Jos. A. Bank, FTB Advisors, Ta’Vie Boutique, and Lily Pulitzer, while the Promenade includes Tuesday Morning and Bullman’s Gym & Kickboxing. The highly visible center entrance is located at a signalized traffic light with daily average traffic counts of 20,391 cars per day on Kingston Pike and a diverse 5-mile population of 149K.Available retail space: 1,000 - 18,000 sf, including former Blackhorse restaurant (9,537 sf). Available office space: 1,005 - 11,687 sf. Build to Suit is also available up to 21,117 sf. New construction office building is retail on the first floor and office on the second and third floors - see Office listing.Western Plaza’s prime location is directly across the street from Knoxville’s most prestigious neighborhood, Sequoyah Hills and just 2 miles from the University of Tennessee and its 28,000 students. Quick interstate access in every direction within 3 miles.For more information on available spaces, please see the attached Master Plan.