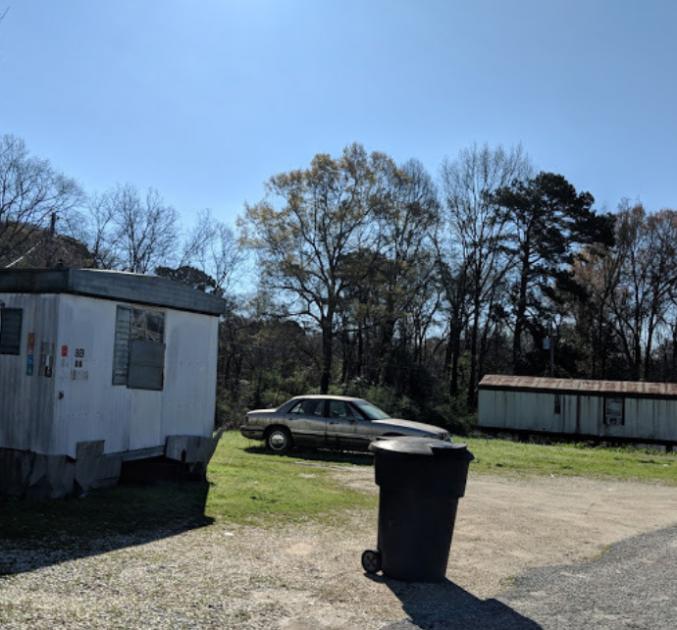
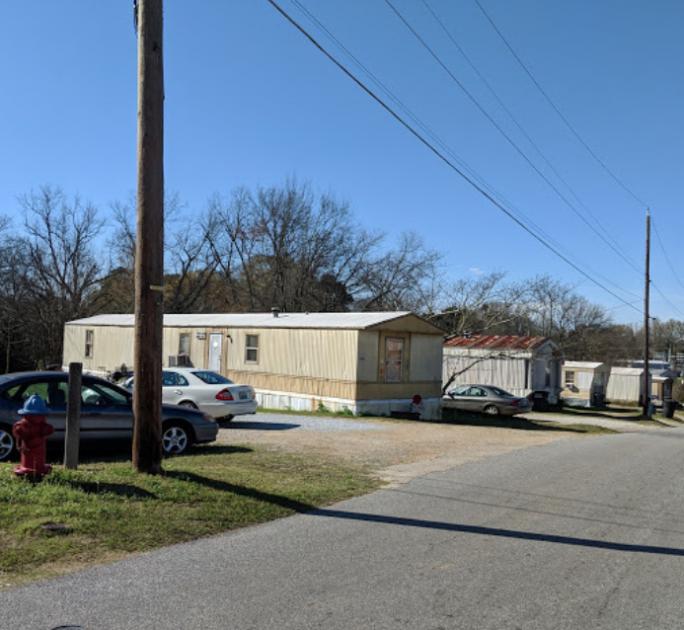
1-Mile | 3-Miles | 5-Miles | ||
---|---|---|---|---|
Total Population | 6,361 | 19,771 | 41,544 | |
Population Median Age | 37 | 38 | 37 | |
Population by Age | 0-9 Yrs | 677 (10%) | 2294 (11%) | 4317 (10%) |
10-19 Yrs | 866 (13%) | 2538 (12%) | 5629 (13%) | |
20-29 Yrs | 1305 (20%) | 3134 (15%) | 7716 (18%) | |
30-39 Yrs | 837 (13%) | 2745 (13%) | 5696 (13%) | |
40-49 Yrs | 640 (10%) | 2521 (12%) | 5518 (13%) | |
50-59 Yrs | 862 (13%) | 2535 (12%) | 5065 (12%) | |
60-69 Yrs | 525 (8%) | 1988 (10%) | 3846 (9%) | |
70+ Yrs | 647 (10%) | 2016 (10%) | 3756 (9%) | |
Median HH Income | $27,467 | $36,460 | $43,747 | |
Total Household Income | < 24K | 1058 (44%) | 3000 (37%) | 5339 (31%) |
25-49K | 665 (28%) | 1873 (23%) | 4034 (23%) | |
50-74K | 283 (12%) | 1065 (13%) | 2450 (14%) | |
75-99K | 169 (7%) | 914 (11%) | 2056 (12%) | |
100-199K | 121 (5%) | 857 (10%) | 2324 (13%) | |
200K+ | 60 (2%) | 234 (2%) | 646 (3%) | |
Highest Education Level | No Diploma | 898 | 1872 | 2942 |
Diploma or GED | 1482 | 4244 | 6901 | |
Some College | 918 | 2871 | 5935 | |
Assoc. Degree | 214 | 942 | 1994 | |
Bachelors Degree | 364 | 1982 | 5379 | |
Higher Degree | 315 | 1539 | 4034 | |
Total Housing Units | 2,651 | 8,925 | 18,688 | |
--Owner-Occupied | 1,160 | 4,330 | 9,176 | |
--Renter-Occupied | 1,197 | 3,613 | 7,673 | |
Owner-Occupied Values | < 100K | 509 | 1284 | 2372 |
100-199K | 385 | 1788 | 3479 | |
200-299K | 152 | 723 | 1824 | |
300-399K | 67 | 273 | 697 | |
400-499K | 20 | 144 | 320 | |
500K+ | 26 | 117 | 484 | |
Total Working Age Population | 4,979 | 15,636 | 33,489 | |
In Work Force | 2,918 | 9,509 | 21,229 | |
Not In Work Force | 2,061 | 6,127 | 12,259 | |
Workforce Employed | 2,630 | 8,785 | 20,049 | |
Workforce Unemployed | 288 | 718 | 1,139 | |
Civlian Workforce | 2,918 | 9,502 | 21,187 | |
Military Workforce | 0 | 6 | 42 | |
Total Households | 2,357 | 7,942 | 16,848 | |
Family Households | 1,407 | 4,706 | 9,920 | |
Non-Family Households | 950 | 3,236 | 6,928 | |
Married Couple | 592 | 2,777 | 6,428 | |
Other Family | 815 | 1,929 | 3,493 | |
Married w/Child | 238 | 1,115 | 2,578 | |
Single Male w/Child | 0 | 65 | 194 | |
Single Female w/Child | 406 | 1,035 | 1,917 |
Population Change Last Two Decades - Plus Projection
2000 | % | 2010 | % | 2020 | % | 2030 | |
---|---|---|---|---|---|---|---|
Alabama | 4,447,100 | +7 | 4,779,736 | +3 | 4,940,253 | +4 | 5,124,380 |
Lee County | 115,092 | +22 | 140,247 | +21 | 169,234 | +13 | 191,587 |
Total Working Age Population:
Total Households:
Total Working Age Population:
Total Households:
Total Working Age Population:
Total Households: