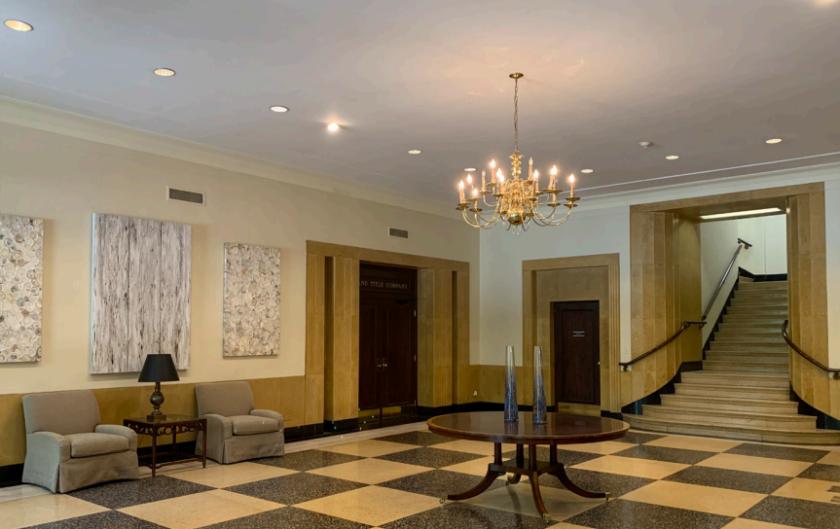
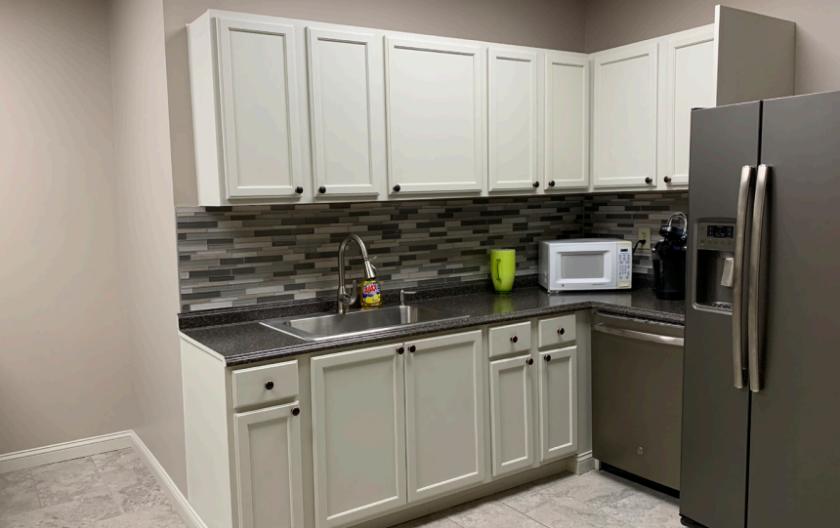
Office Space
600 20th Street North Birmingham, AL 35203
600 20th Street North Birmingham, AL 35203
Details & Description
Property Highlights
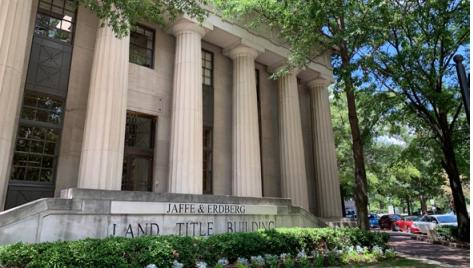
• Tenants: Jaffe and Erdberg, Land Title Company, Sheffield and Lentine, Hodges Johnson Law Parnell and Parnell Law
• Located in the heart of Birmingham’s CBD only a short walk to courthouse and restaurants
Listing Agents

Casey Howard
O: 205-323-2020
M: 205-458-8130
choward@harbertrealty.com
O: 205-323-2020
M: 205-458-8130
choward@harbertrealty.com
While we strive to provide the most accurate information, all listing information, and demographic data, is provided by third-parties. As such, MyEListing will not be responsible for the accuracy of the information. It is strongly recommended that you verify all information with the listing agent, and any relevant agencies, prior to making any decisions.