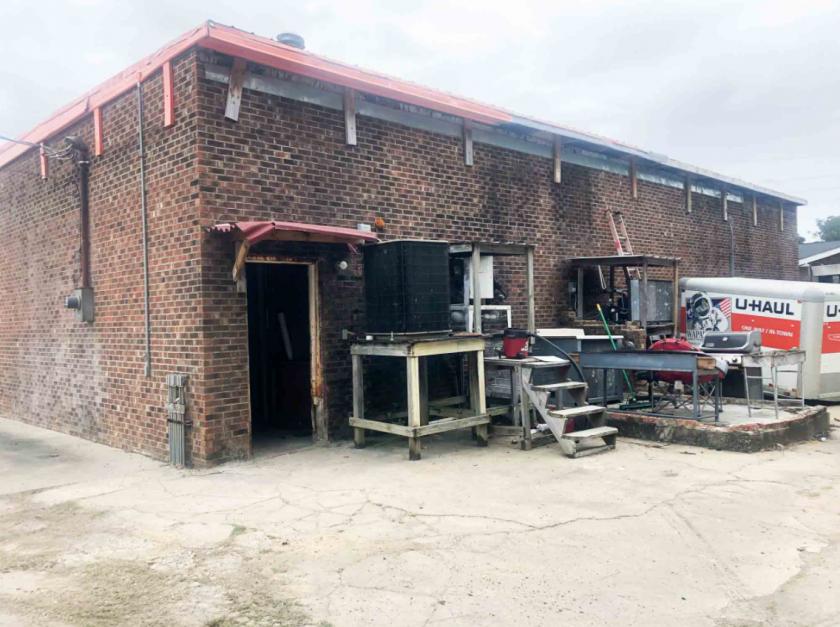
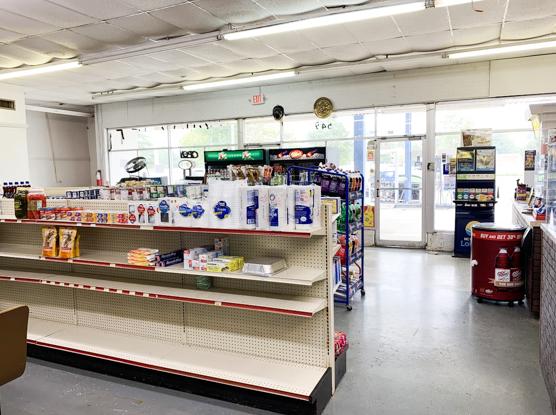
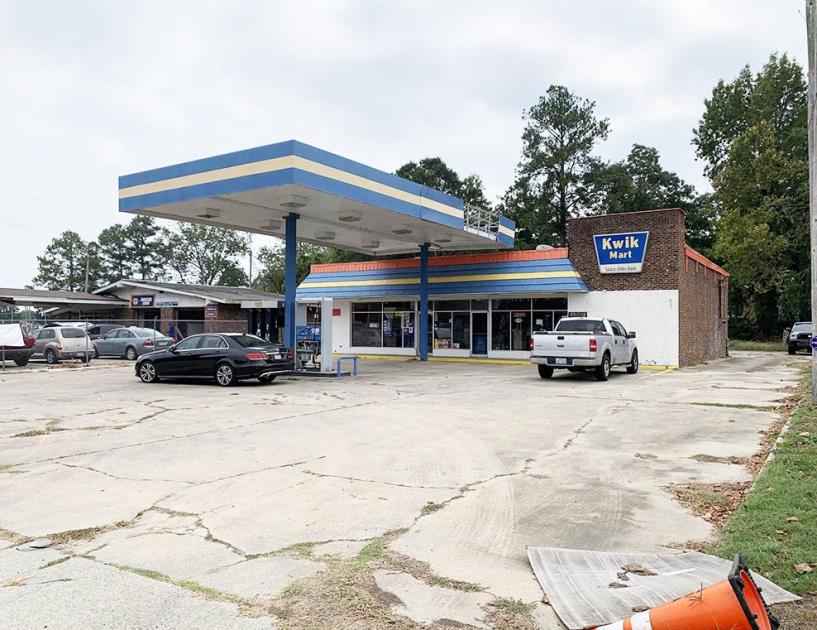
1-Mile | 3-Miles | 5-Miles | ||
---|---|---|---|---|
Total Population | 4,043 | 12,085 | 19,882 | |
Population Median Age | 39 | 41 | 41 | |
Population by Age | 0-9 Yrs | 494 (12%) | 1644 (13%) | 2329 (11%) |
10-19 Yrs | 719 (17%) | 1711 (14%) | 2752 (13%) | |
20-29 Yrs | 331 (8%) | 1283 (10%) | 2155 (10%) | |
30-39 Yrs | 505 (12%) | 1145 (9%) | 2028 (10%) | |
40-49 Yrs | 391 (9%) | 1353 (11%) | 2293 (11%) | |
50-59 Yrs | 675 (16%) | 1588 (13%) | 2750 (13%) | |
60-69 Yrs | 539 (13%) | 1588 (13%) | 2758 (13%) | |
70+ Yrs | 389 (9%) | 1772 (14%) | 2816 (14%) | |
Median HH Income | $29,920 | $34,108 | $39,120 | |
Total Household Income | < 24K | 742 (45%) | 1972 (39%) | 2894 (35%) |
25-49K | 432 (26%) | 1182 (23%) | 1877 (23%) | |
50-74K | 264 (16%) | 726 (14%) | 1357 (16%) | |
75-99K | 77 (4%) | 348 (7%) | 720 (8%) | |
100-199K | 117 (7%) | 548 (11%) | 1029 (12%) | |
200K+ | 12 (0%) | 156 (3%) | 227 (2%) | |
Highest Education Level | No Diploma | 476 | 1123 | 1751 |
Diploma or GED | 860 | 2500 | 4422 | |
Some College | 539 | 1663 | 2843 | |
Assoc. Degree | 195 | 817 | 1555 | |
Bachelors Degree | 242 | 1069 | 1818 | |
Higher Degree | 322 | 862 | 1273 | |
Total Housing Units | 1,998 | 5,960 | 9,950 | |
--Owner-Occupied | 624 | 2,472 | 4,769 | |
--Renter-Occupied | 1,020 | 2,460 | 3,334 | |
Owner-Occupied Values | < 100K | 366 | 900 | 1755 |
100-199K | 131 | 691 | 1449 | |
200-299K | 70 | 492 | 837 | |
300-399K | 34 | 228 | 405 | |
400-499K | 11 | 91 | 191 | |
500K+ | 11 | 70 | 132 | |
Total Working Age Population | 3,191 | 9,390 | 15,864 | |
In Work Force | 1,636 | 4,989 | 8,687 | |
Not In Work Force | 1,554 | 4,401 | 7,177 | |
Workforce Employed | 1,330 | 4,401 | 7,772 | |
Workforce Unemployed | 299 | 582 | 908 | |
Civlian Workforce | 1,629 | 4,982 | 8,680 | |
Military Workforce | 7 | 7 | 7 | |
Total Households | 1,644 | 4,932 | 8,104 | |
Family Households | 837 | 2,878 | 4,922 | |
Non-Family Households | 807 | 2,054 | 3,182 | |
Married Couple | 592 | 1,901 | 3,350 | |
Other Family | 246 | 977 | 1,572 | |
Married w/Child | 166 | 639 | 1,054 | |
Single Male w/Child | 1 | 29 | 97 | |
Single Female w/Child | 106 | 492 | 706 |
Population Change Last Two Decades - Plus Projection
2000 | % | 2010 | % | 2020 | % | 2030 | |
---|---|---|---|---|---|---|---|
North Carolina | 8,049,313 | +18 | 9,535,483 | +12 | 10,647,005 | +11 | 11,847,719 |
Beaufort County | 44,958 | +6 | 47,759 | -1 | 47,363 | -1 | 46,953 |
Pitt County | 133,798 | +26 | 168,148 | +8 | 182,401 | +8 | 197,470 |
Total Working Age Population:
Total Households:
Total Working Age Population:
Total Households:
Total Working Age Population:
Total Households: