Description
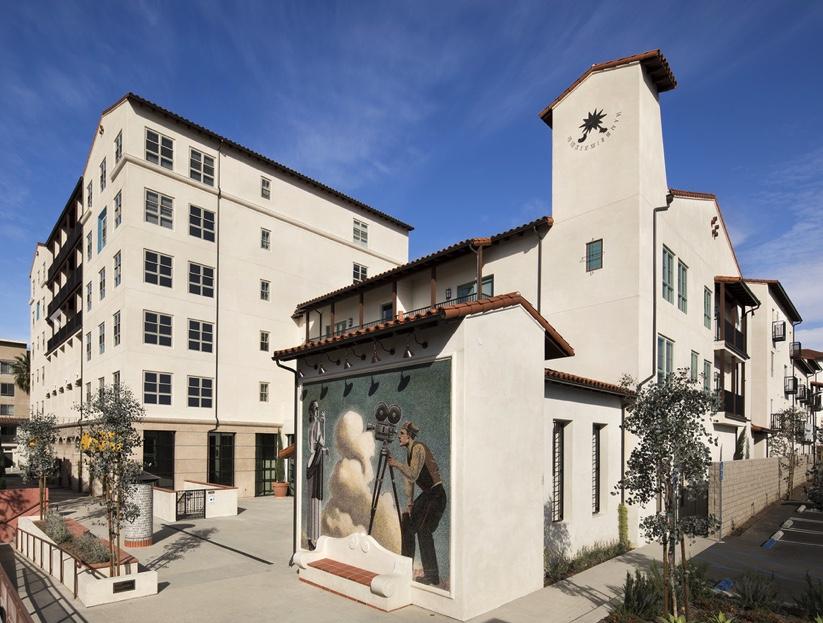
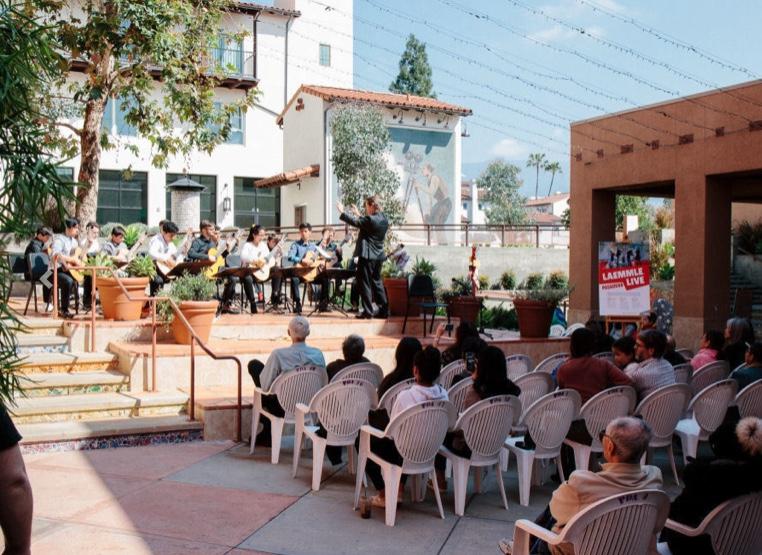
Destination retail or café space with common area patio space located at the Andalucia, a 117-unit luxury apartment community one block from Colorado Blvd.
Highlights
Destination retail or café space with common area patio space located at the Andalucia, a 117-unit luxury apartment community one block from Colorado Blvd.
The Retail Shops at Vroman’s Courtyard and Entertainment Plaza are adjacent to the 7-screen Laemmle Theater and Pasadena’s famous Vroman’s Bookstore
On site, subterranean parking in the Andalucia designated for retail tenants
Located in the historic Pasadena Playhouse Village, the city of Pasadena’s hub of Arts & Culture with over 804 residential units and approximately 375,000 SF of commercial development under construction or proposed
Only twelve miles from Downtown LA, the City of Pasadena’s rich history, cultural museums, fine dining, shopping and entertainment draw an average of 15,000-20,000 visitors on weekends, which is enhanced by the increase in ridership on the MTA’s Gold Line
No part of this information may be copied, reproduced, repurposed, or screen-captured for any commercial purpose without prior written authorization from MyEListing.
While we strive to provide the most accurate information, all listing information, and demographic data, is provided by third-parties. As such, MyEListing will not be responsible for the accuracy of the information. It is strongly recommended that you verify all information with the listing agent, and any relevant agencies, prior to making any decisions.
What is the asking price for 686 Union Street in Pasadena?
The asking price for 686 Union Street is $39.00 a SF per Year
What is the building size of this commercial Retail property?
The size of this multi-unit property varies between 1220 - 1227 square feet
What kind of Retail is the propery at 686 Union Street?
The property at 686 Union Street Pasadena, CA 91101 is listed as a Other Retail Retail property
What is the population within 1 mile of 686 Union Street in Pasadena?
The population within 1 mile of 686 Union Street Pasadena, CA 91101 is 44,081 people.
Who do I contact for questions about 686 Union Street?
You should contact the listing agent,
Jodi Shoemake, for any details regarding this commercial listing.