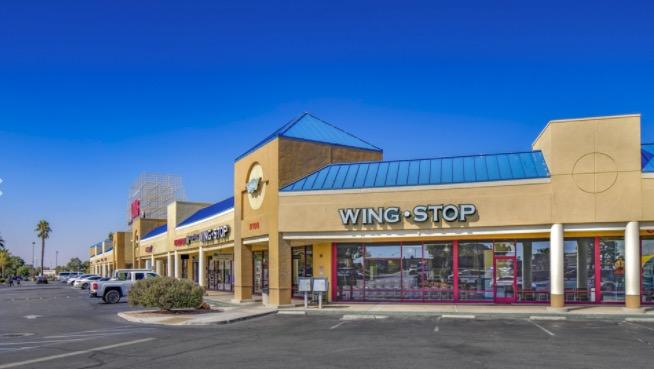
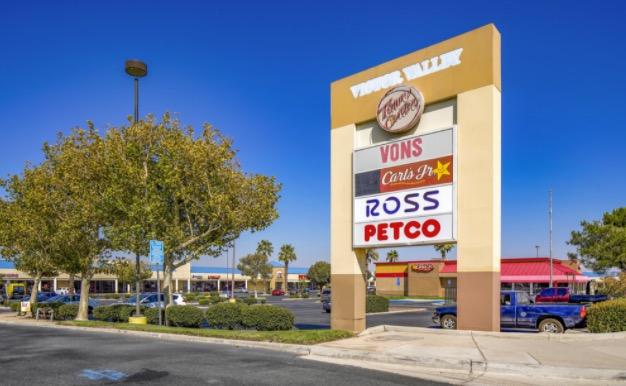
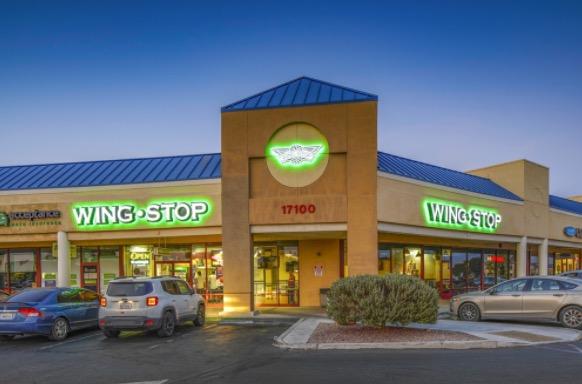
1-Mile | 3-Miles | 5-Miles | ||
---|---|---|---|---|
Total Population | 7,841 | 59,482 | 171,247 | |
Population Median Age | 34 | 36 | 35 | |
Population by Age | 0-9 Yrs | 1296 (16%) | 9136 (15%) | 28172 (16%) |
10-19 Yrs | 1307 (16%) | 9647 (16%) | 29071 (16%) | |
20-29 Yrs | 1196 (15%) | 8459 (14%) | 24537 (14%) | |
30-39 Yrs | 958 (12%) | 6465 (10%) | 19252 (11%) | |
40-49 Yrs | 958 (12%) | 6498 (10%) | 18713 (10%) | |
50-59 Yrs | 1008 (12%) | 7659 (12%) | 20771 (12%) | |
60-69 Yrs | 562 (7%) | 6007 (10%) | 16445 (9%) | |
70+ Yrs | 555 (7%) | 5611 (9%) | 14286 (8%) | |
Median HH Income | $45,790 | $53,865 | $50,910 | |
Total Household Income | < 24K | 578 (25%) | 4272 (23%) | 12944 (25%) |
25-49K | 615 (27%) | 4163 (22%) | 12242 (23%) | |
50-74K | 390 (17%) | 3265 (17%) | 9614 (18%) | |
75-99K | 343 (15%) | 2236 (12%) | 5937 (11%) | |
100-199K | 283 (12%) | 3598 (19%) | 8846 (17%) | |
200K+ | 62 (2%) | 616 (3%) | 1619 (3%) | |
Highest Education Level | No Diploma | 1094 | 6973 | 20518 |
Diploma or GED | 1253 | 10720 | 31090 | |
Some College | 1345 | 9910 | 27509 | |
Assoc. Degree | 353 | 3420 | 8853 | |
Bachelors Degree | 400 | 3977 | 9394 | |
Higher Degree | 144 | 1700 | 4573 | |
Total Housing Units | 2,478 | 19,748 | 54,994 | |
--Owner-Occupied | 1,129 | 10,881 | 29,347 | |
--Renter-Occupied | 1,142 | 7,268 | 21,853 | |
Owner-Occupied Values | < 100K | 42 | 937 | 2657 |
100-199K | 517 | 3553 | 9597 | |
200-299K | 475 | 4120 | 10652 | |
300-399K | 68 | 1314 | 3926 | |
400-499K | 25 | 559 | 1405 | |
500K+ | 2 | 399 | 1110 | |
Total Working Age Population | 5,798 | 44,418 | 125,400 | |
In Work Force | 3,298 | 24,020 | 68,798 | |
Not In Work Force | 2,500 | 20,398 | 56,602 | |
Workforce Employed | 2,840 | 21,260 | 60,250 | |
Workforce Unemployed | 437 | 2,679 | 8,403 | |
Civlian Workforce | 3,277 | 23,939 | 68,653 | |
Military Workforce | 21 | 81 | 145 | |
Total Households | 2,271 | 18,149 | 51,201 | |
Family Households | 1,634 | 13,564 | 39,491 | |
Non-Family Households | 637 | 4,585 | 11,709 | |
Married Couple | 999 | 9,142 | 25,578 | |
Other Family | 634 | 4,422 | 13,913 | |
Married w/Child | 492 | 3,786 | 11,329 | |
Single Male w/Child | 93 | 727 | 2,227 | |
Single Female w/Child | 258 | 1,551 | 5,206 |
Population Change Last Two Decades - Plus Projection
2000 | % | 2010 | % | 2020 | % | 2030 | |
---|---|---|---|---|---|---|---|
California | 33,871,648 | +10 | 37,253,956 | +9 | 40,467,295 | +8 | 43,631,295 |
San Bernardino County | 1,709,434 | +19 | 2,035,210 | +9 | 2,223,189 | +11 | 2,468,202 |
Total Working Age Population:
Total Households:
Total Working Age Population:
Total Households:
Total Working Age Population:
Total Households: