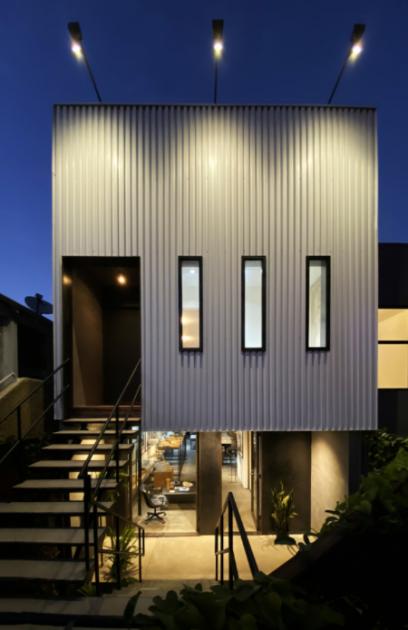
1-Mile | 3-Miles | 5-Miles | ||
---|---|---|---|---|
Total Population | 43,126 | 344,870 | 1,074,208 | |
Population Median Age | 38 | 39 | 38 | |
Population by Age | 0-9 Yrs | 4387 (10%) | 34841 (10%) | 107736 (10%) |
10-19 Yrs | 4532 (10%) | 31813 (9%) | 109187 (10%) | |
20-29 Yrs | 7424 (17%) | 59626 (17%) | 201615 (18%) | |
30-39 Yrs | 7381 (17%) | 61461 (17%) | 186142 (17%) | |
40-49 Yrs | 6898 (15%) | 50314 (14%) | 148706 (13%) | |
50-59 Yrs | 5458 (12%) | 42388 (12%) | 130213 (12%) | |
60-69 Yrs | 3832 (8%) | 32498 (9%) | 97519 (9%) | |
70+ Yrs | 3214 (7%) | 31929 (9%) | 93090 (8%) | |
Median HH Income | $61,952 | $66,314 | $56,619 | |
Total Household Income | < 24K | 3154 (18%) | 30317 (20%) | 106270 (24%) |
25-49K | 3408 (20%) | 27252 (18%) | 91906 (20%) | |
50-74K | 3407 (20%) | 23841 (16%) | 70703 (16%) | |
75-99K | 1944 (11%) | 17340 (11%) | 47322 (10%) | |
100-199K | 3423 (20%) | 31288 (21%) | 80630 (18%) | |
200K+ | 1382 (8%) | 17216 (11%) | 41378 (9%) | |
Highest Education Level | No Diploma | 6028 | 34044 | 138452 |
Diploma or GED | 5204 | 38615 | 127457 | |
Some College | 6429 | 46499 | 134124 | |
Assoc. Degree | 1913 | 15049 | 43284 | |
Bachelors Degree | 7049 | 73969 | 209186 | |
Higher Degree | 4278 | 47161 | 119202 | |
Total Housing Units | 17,969 | 161,387 | 481,132 | |
--Owner-Occupied | 5,799 | 44,488 | 118,121 | |
--Renter-Occupied | 10,918 | 102,766 | 320,088 | |
Owner-Occupied Values | < 100K | 152 | 803 | 2233 |
100-199K | 35 | 395 | 1495 | |
200-299K | 82 | 1416 | 4606 | |
300-399K | 282 | 2825 | 9323 | |
400-499K | 395 | 3383 | 10658 | |
500K+ | 4853 | 35666 | 89807 | |
Total Working Age Population | 35,937 | 290,439 | 905,668 | |
In Work Force | 24,895 | 201,332 | 620,944 | |
Not In Work Force | 11,043 | 89,106 | 284,723 | |
Workforce Employed | 23,444 | 189,490 | 577,874 | |
Workforce Unemployed | 1,441 | 11,728 | 42,842 | |
Civlian Workforce | 24,885 | 201,219 | 620,716 | |
Military Workforce | 9 | 114 | 228 | |
Total Households | 16,717 | 147,254 | 438,209 | |
Family Households | 9,079 | 71,682 | 213,688 | |
Non-Family Households | 7,638 | 75,572 | 224,521 | |
Married Couple | 5,881 | 48,245 | 137,093 | |
Other Family | 3,199 | 23,437 | 76,594 | |
Married w/Child | 2,662 | 19,934 | 55,726 | |
Single Male w/Child | 286 | 2,763 | 8,531 | |
Single Female w/Child | 885 | 6,657 | 23,174 |
Population Change Last Two Decades - Plus Projection
2000 | % | 2010 | % | 2020 | % | 2030 | |
---|---|---|---|---|---|---|---|
California | 33,871,648 | +10 | 37,253,956 | +9 | 40,467,295 | +8 | 43,631,295 |
Los Angeles County | 9,519,338 | +3 | 9,818,605 | +6 | 10,369,367 | +4 | 10,759,850 |
Total Working Age Population:
Total Households:
Total Working Age Population:
Total Households:
Total Working Age Population:
Total Households: