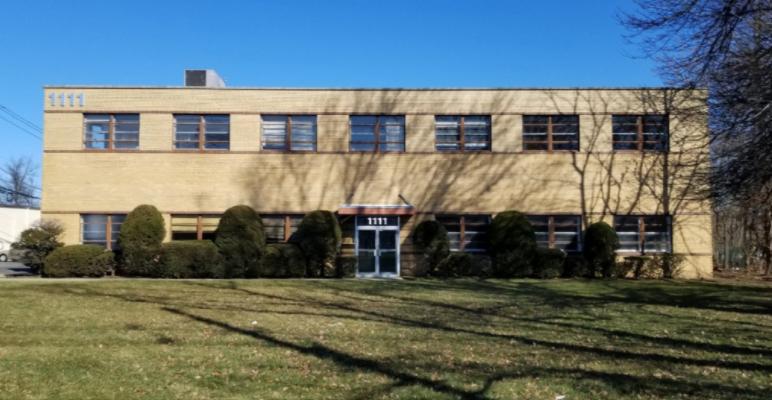
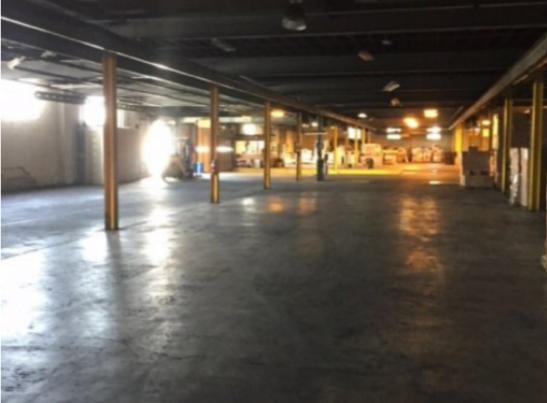
1-Mile | 3-Miles | 5-Miles | ||
---|---|---|---|---|
Total Population | 14,080 | 144,793 | 482,469 | |
Population Median Age | 43 | 40 | 39 | |
Population by Age | 0-9 Yrs | 1359 (9%) | 16726 (11%) | 60619 (12%) |
10-19 Yrs | 1512 (10%) | 18269 (12%) | 63950 (13%) | |
20-29 Yrs | 1646 (11%) | 15661 (10%) | 59158 (12%) | |
30-39 Yrs | 1737 (12%) | 18157 (12%) | 62557 (12%) | |
40-49 Yrs | 1616 (11%) | 20585 (14%) | 69268 (14%) | |
50-59 Yrs | 2663 (18%) | 23263 (16%) | 70847 (14%) | |
60-69 Yrs | 1779 (12%) | 16835 (11%) | 50640 (10%) | |
70+ Yrs | 1767 (12%) | 15296 (10%) | 45429 (9%) | |
Median HH Income | $99,820 | $96,208 | $76,903 | |
Total Household Income | < 24K | 651 (12%) | 5855 (11%) | 27862 (16%) |
25-49K | 557 (10%) | 6864 (13%) | 30100 (17%) | |
50-74K | 523 (10%) | 7863 (15%) | 25454 (14%) | |
75-99K | 832 (16%) | 6421 (12%) | 19777 (11%) | |
100-199K | 1930 (37%) | 15811 (30%) | 41467 (24%) | |
200K+ | 622 (12%) | 9246 (17%) | 25185 (14%) | |
Highest Education Level | No Diploma | 1098 | 8319 | 34900 |
Diploma or GED | 3141 | 24682 | 87987 | |
Some College | 1644 | 15409 | 56881 | |
Assoc. Degree | 500 | 5603 | 19137 | |
Bachelors Degree | 2509 | 28582 | 74772 | |
Higher Degree | 1506 | 19508 | 54248 | |
Total Housing Units | 5,306 | 55,033 | 184,661 | |
--Owner-Occupied | 3,980 | 36,653 | 97,913 | |
--Renter-Occupied | 1,136 | 15,409 | 71,932 | |
Owner-Occupied Values | < 100K | 111 | 818 | 3136 |
100-199K | 287 | 2084 | 10506 | |
200-299K | 795 | 7913 | 21899 | |
300-399K | 1515 | 10308 | 20126 | |
400-499K | 881 | 5047 | 11160 | |
500K+ | 391 | 10483 | 31086 | |
Total Working Age Population | 11,745 | 116,272 | 382,680 | |
In Work Force | 7,846 | 79,965 | 262,575 | |
Not In Work Force | 3,899 | 36,307 | 120,105 | |
Workforce Employed | 7,444 | 75,624 | 242,532 | |
Workforce Unemployed | 379 | 4,287 | 19,819 | |
Civlian Workforce | 7,823 | 79,911 | 262,350 | |
Military Workforce | 23 | 54 | 224 | |
Total Households | 5,115 | 52,061 | 169,845 | |
Family Households | 3,718 | 37,646 | 118,119 | |
Non-Family Households | 1,397 | 14,416 | 51,726 | |
Married Couple | 3,076 | 29,283 | 81,557 | |
Other Family | 643 | 8,362 | 36,562 | |
Married w/Child | 1,133 | 13,454 | 39,127 | |
Single Male w/Child | 66 | 745 | 3,951 | |
Single Female w/Child | 182 | 2,599 | 13,118 |
Population Change Last Two Decades - Plus Projection
2000 | % | 2010 | % | 2020 | % | 2030 | |
---|---|---|---|---|---|---|---|
New Jersey | 8,414,350 | +4 | 8,791,894 | +4 | 9,132,700 | +4 | 9,530,900 |
Morris County | 470,212 | +5 | 492,276 | +3 | 509,100 | +5 | 535,600 |
Essex County | 793,633 | -1 | 783,969 | +3 | 808,300 | +3 | 829,800 |
Union County | 522,541 | +3 | 536,499 | +7 | 573,000 | +6 | 605,600 |
Total Working Age Population:
Total Households:
Total Working Age Population:
Total Households:
Total Working Age Population:
Total Households: