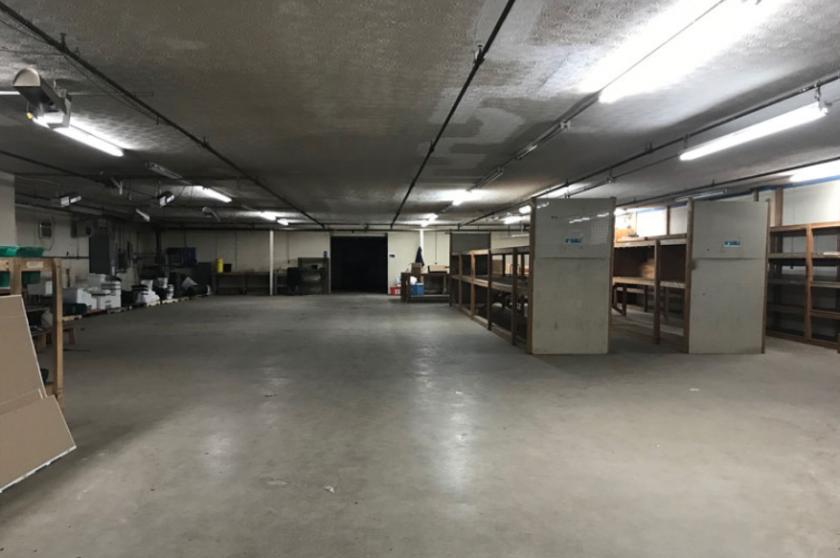
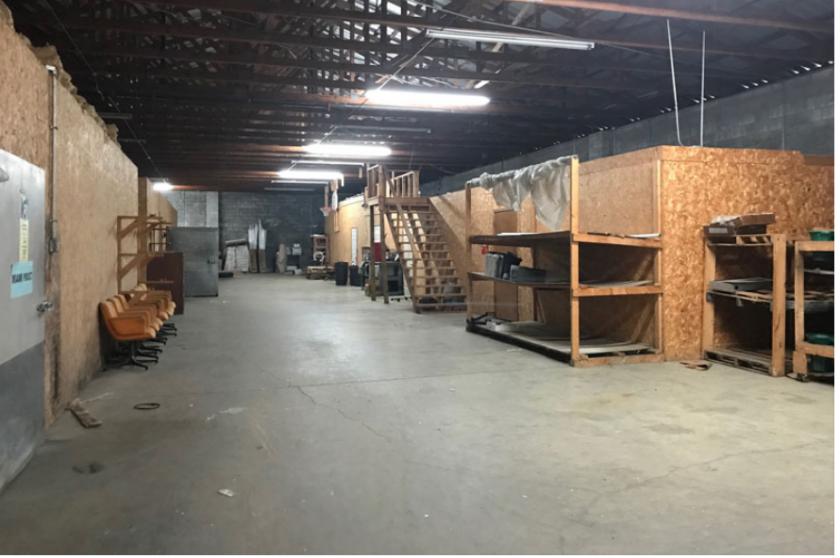
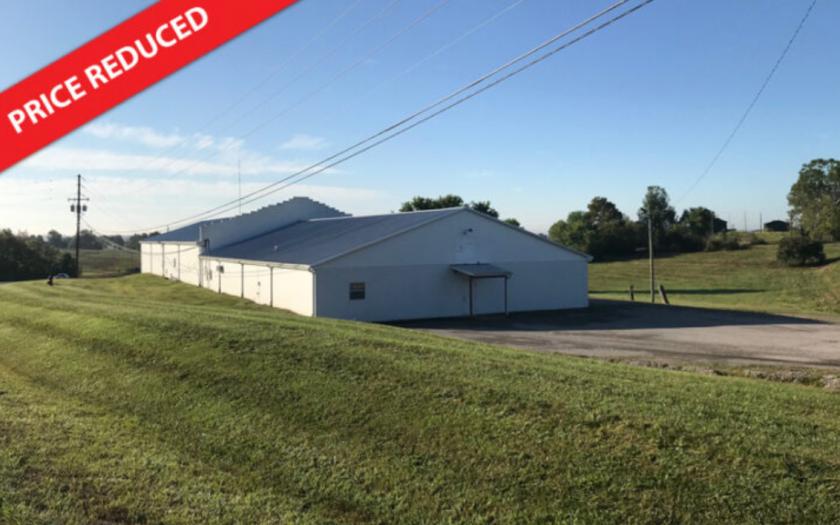
1-Mile | 3-Miles | 5-Miles | ||
---|---|---|---|---|
Total Population | 454 | 3,753 | 7,937 | |
Population Median Age | 39 | 40 | 40 | |
Population by Age | 0-9 Yrs | 69 (15%) | 502 (13%) | 1014 (12%) |
10-19 Yrs | 47 (10%) | 459 (12%) | 1025 (12%) | |
20-29 Yrs | 81 (17%) | 581 (15%) | 1041 (13%) | |
30-39 Yrs | 39 (8%) | 350 (9%) | 828 (10%) | |
40-49 Yrs | 45 (9%) | 434 (11%) | 1019 (12%) | |
50-59 Yrs | 57 (12%) | 495 (13%) | 1058 (13%) | |
60-69 Yrs | 52 (11%) | 401 (10%) | 885 (11%) | |
70+ Yrs | 65 (14%) | 529 (14%) | 1068 (13%) | |
Median HH Income | $35,528 | $38,638 | $39,189 | |
Total Household Income | < 24K | 73 (37%) | 537 (34%) | 1079 (33%) |
25-49K | 42 (21%) | 400 (25%) | 869 (27%) | |
50-74K | 41 (20%) | 296 (18%) | 576 (17%) | |
75-99K | 17 (8%) | 130 (8%) | 296 (9%) | |
100-199K | 17 (8%) | 143 (9%) | 309 (9%) | |
200K+ | 8 (4%) | 52 (3%) | 83 (2%) | |
Highest Education Level | No Diploma | 77 | 647 | 1335 |
Diploma or GED | 127 | 965 | 2076 | |
Some College | 46 | 425 | 910 | |
Assoc. Degree | 19 | 166 | 342 | |
Bachelors Degree | 17 | 141 | 321 | |
Higher Degree | 24 | 191 | 410 | |
Total Housing Units | 215 | 1,694 | 3,612 | |
--Owner-Occupied | 113 | 975 | 2,063 | |
--Renter-Occupied | 84 | 582 | 1,148 | |
Owner-Occupied Values | < 100K | 48 | 454 | 900 |
100-199K | 46 | 380 | 817 | |
200-299K | 12 | 84 | 206 | |
300-399K | 3 | 37 | 91 | |
400-499K | 2 | 12 | 28 | |
500K+ | 2 | 9 | 20 | |
Total Working Age Population | 360 | 2,995 | 6,327 | |
In Work Force | 204 | 1,614 | 3,392 | |
Not In Work Force | 157 | 1,381 | 2,935 | |
Workforce Employed | 183 | 1,452 | 3,058 | |
Workforce Unemployed | 21 | 161 | 334 | |
Civlian Workforce | 204 | 1,614 | 3,392 | |
Military Workforce | 0 | 0 | 0 | |
Total Households | 197 | 1,558 | 3,211 | |
Family Households | 140 | 1,095 | 2,256 | |
Non-Family Households | 57 | 463 | 955 | |
Married Couple | 81 | 655 | 1,466 | |
Other Family | 59 | 440 | 790 | |
Married w/Child | 14 | 157 | 435 | |
Single Male w/Child | 2 | 42 | 88 | |
Single Female w/Child | 45 | 297 | 483 |
Population Change Last Two Decades - Plus Projection
2000 | % | 2010 | % | 2020 | % | 2030 | |
---|---|---|---|---|---|---|---|
Kentucky | 4,041,769 | +7 | 4,339,367 | +4 | 4,533,464 | +4 | 4,726,382 |
Garrard County | 14,792 | +14 | 16,912 | +3 | 17,476 | 0 | 17,543 |
Boyle County | 27,697 | +3 | 28,432 | +7 | 30,550 | +4 | 31,810 |
Lincoln County | 23,361 | +6 | 24,742 | -2 | 24,324 | -3 | 23,576 |
Total Working Age Population:
Total Households:
Total Working Age Population:
Total Households:
Total Working Age Population:
Total Households: