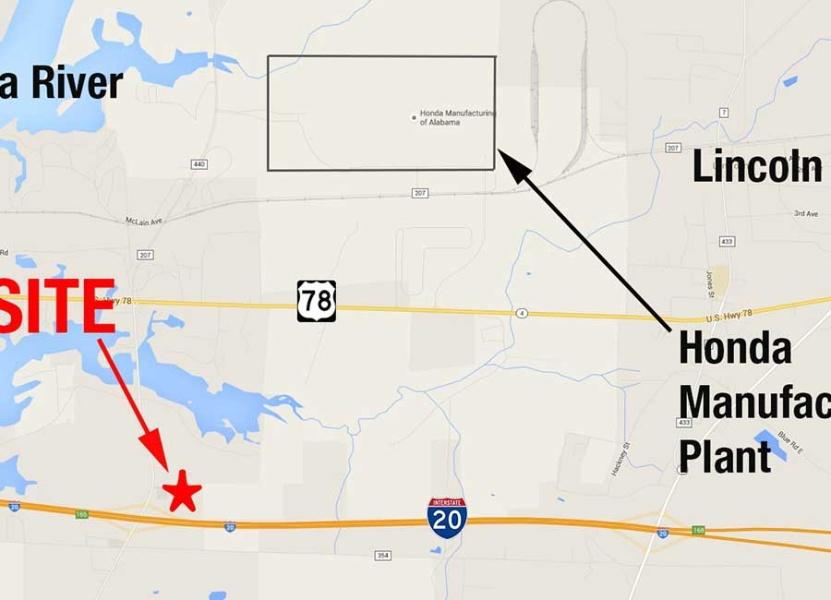
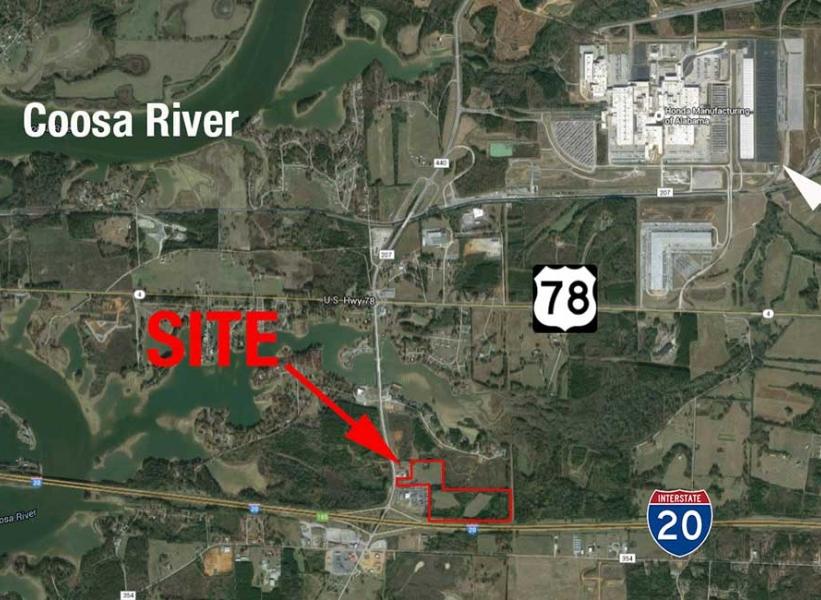
1-Mile | 3-Miles | 5-Miles | ||
---|---|---|---|---|
Total Population | 501 | 3,972 | 10,690 | |
Population Median Age | 41 | 41 | 40 | |
Population by Age | 0-9 Yrs | 64 (12%) | 447 (11%) | 1069 (10%) |
10-19 Yrs | 57 (11%) | 461 (11%) | 1386 (12%) | |
20-29 Yrs | 44 (8%) | 422 (10%) | 1320 (12%) | |
30-39 Yrs | 57 (11%) | 439 (11%) | 1264 (11%) | |
40-49 Yrs | 74 (14%) | 582 (14%) | 1568 (14%) | |
50-59 Yrs | 89 (17%) | 717 (18%) | 1756 (16%) | |
60-69 Yrs | 69 (13%) | 523 (13%) | 1300 (12%) | |
70+ Yrs | 47 (9%) | 383 (9%) | 1028 (9%) | |
Median HH Income | $58,670 | $57,140 | $56,505 | |
Total Household Income | < 24K | 35 (18%) | 286 (18%) | 872 (21%) |
25-49K | 44 (23%) | 378 (24%) | 969 (23%) | |
50-74K | 45 (23%) | 338 (21%) | 800 (19%) | |
75-99K | 35 (18%) | 253 (16%) | 674 (16%) | |
100-199K | 33 (17%) | 262 (17%) | 698 (16%) | |
200K+ | 0 (0%) | 21 (1%) | 107 (2%) | |
Highest Education Level | No Diploma | 66 | 460 | 1070 |
Diploma or GED | 124 | 975 | 2628 | |
Some College | 70 | 635 | 1779 | |
Assoc. Degree | 26 | 247 | 768 | |
Bachelors Degree | 64 | 425 | 941 | |
Higher Degree | 15 | 159 | 441 | |
Total Housing Units | 292 | 2,208 | 5,399 | |
--Owner-Occupied | 148 | 1,159 | 3,026 | |
--Renter-Occupied | 43 | 379 | 1,096 | |
Owner-Occupied Values | < 100K | 57 | 434 | 1054 |
100-199K | 49 | 377 | 1048 | |
200-299K | 30 | 226 | 534 | |
300-399K | 7 | 71 | 187 | |
400-499K | 2 | 31 | 120 | |
500K+ | 4 | 20 | 82 | |
Total Working Age Population | 401 | 3,231 | 8,713 | |
In Work Force | 227 | 1,939 | 5,462 | |
Not In Work Force | 174 | 1,293 | 3,251 | |
Workforce Employed | 209 | 1,804 | 5,050 | |
Workforce Unemployed | 16 | 124 | 395 | |
Civlian Workforce | 225 | 1,928 | 5,444 | |
Military Workforce | 2 | 11 | 17 | |
Total Households | 191 | 1,539 | 4,122 | |
Family Households | 144 | 1,097 | 2,906 | |
Non-Family Households | 48 | 442 | 1,216 | |
Married Couple | 106 | 821 | 2,186 | |
Other Family | 37 | 276 | 720 | |
Married w/Child | 24 | 199 | 640 | |
Single Male w/Child | 2 | 15 | 59 | |
Single Female w/Child | 19 | 130 | 299 |
Population Change Last Two Decades - Plus Projection
2000 | % | 2010 | % | 2020 | % | 2030 | |
---|---|---|---|---|---|---|---|
Alabama | 4,447,100 | +7 | 4,779,736 | +3 | 4,940,253 | +4 | 5,124,380 |
St. Clair County | 64,742 | +29 | 83,593 | +8 | 90,634 | +11 | 100,206 |
Talladega County | 80,321 | +2 | 82,291 | -3 | 79,964 | -2 | 78,524 |
Total Working Age Population:
Total Households:
Total Working Age Population:
Total Households:
Total Working Age Population:
Total Households: