Description
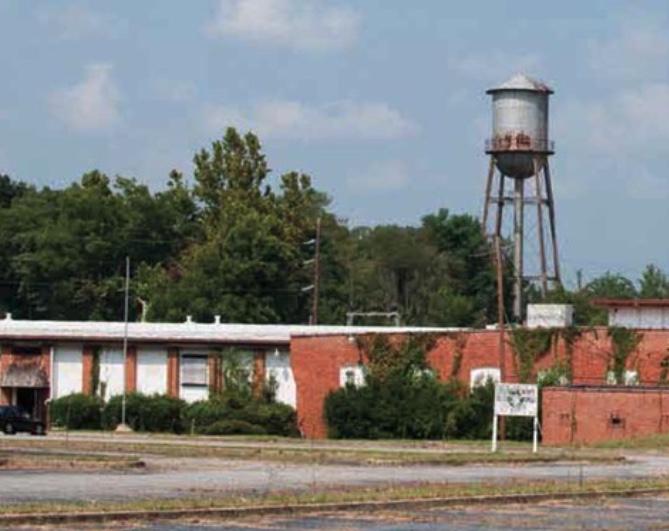
The Grantville Mill was constructed around the turn of the 20th century, to largest building was completed in 1901, to produce cotton products that later included uniforms and canvas for allied troops fighting in the First World War. Additional buildings and improvements were not added to the property until the 1980's when the mill closed. Westpoint Pepperell owned the asset during its use as a cotton mill and textile manufacturing facility. The facility has been used for various light industrial purposes since being decommissioned as a mill.
Highlights
High volume water well capable of producing over 140 gallons of water per minute, nearly 200,000 gallons per day.
Location between Atlanta and Columbus on I-85 allows easy distribution to these population centers and the entire Southeast.
Historic facility capable of being reused, permanently or temporarily, or salvaged for valuable vintage building materials including antique heart pine, maple and bricks.
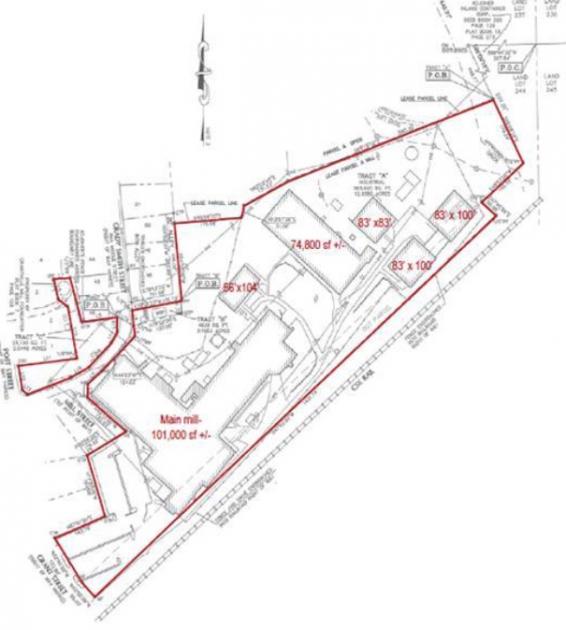
Large parcel size and building configurations allow flexibility of use and timing.
Grantville and Coweta County are eager to put this facility to new use creating jobs and income opportunity.
Bank ownership allows a clean quick sale to a subsequent owner.
No part of this information may be copied, reproduced, repurposed, or screen-captured for any commercial purpose without prior written authorization from MyEListing.
While we strive to provide the most accurate information, all listing information, and demographic data, is provided by third-parties. As such, MyEListing will not be responsible for the accuracy of the information. It is strongly recommended that you verify all information with the listing agent, and any relevant agencies, prior to making any decisions.
What is the asking price for 41 Industrial Way in Grantville?
The asking price for 41 Industrial Way is $800,000
What is the building size of this Industrial property in Grantville, GA?
The size of the building/unit at 41 Industrial Way in Grantville is 125,000 square feet
How much land does the Grantville, GA property at 41 Industrial Way include?
41 Industrial Way in Grantville includes 13.590 acres of land
What kind of Industrial is the propery at 41 Industrial Way?
The property at 41 Industrial Way Grantville, GA 30220 is listed as a Warehouse Industrial property
What is the population within 1 mile of 41 Industrial Way in Grantville?
The population within 1 mile of 41 Industrial Way Grantville, GA 30220 is 503 people.
Who do I contact for questions about 41 Industrial Way?
You should contact the listing agent,
Trey DeSantis, for any details regarding this commercial listing.