Specialty Real Estate
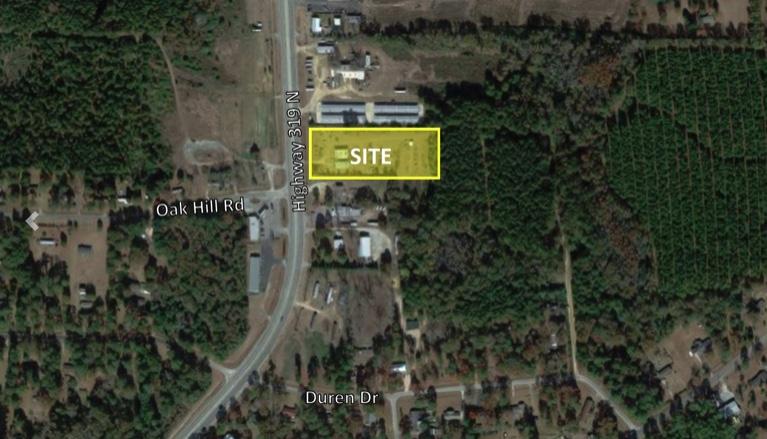
13142 US-319 Thomasville, GA 31757
13142 US-319 Thomasville, GA 31757
Details & Description
Listing Agents

Trey DeSantis
O: 850-385-6363
M: 850-766-6868
trey@tlgproperty.com
O: 850-385-6363
M: 850-766-6868
trey@tlgproperty.com
While we strive to provide the most accurate information, all listing information, and demographic data, is provided by third-parties. As such, MyEListing will not be responsible for the accuracy of the information. It is strongly recommended that you verify all information with the listing agent, and any relevant agencies, prior to making any decisions.