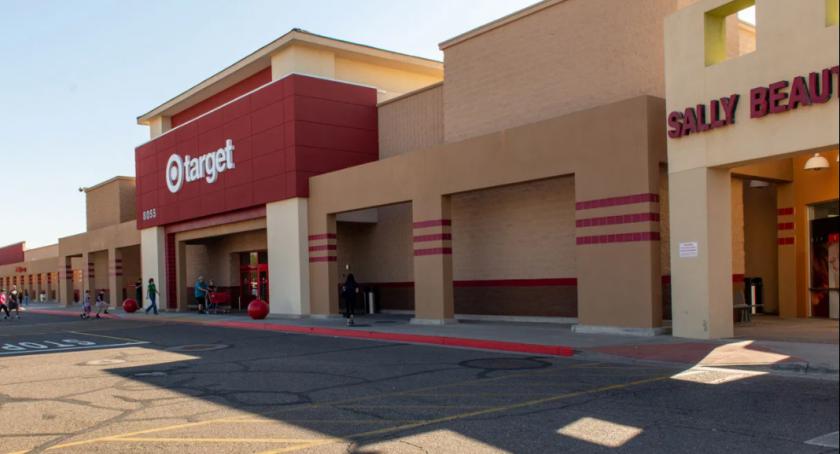
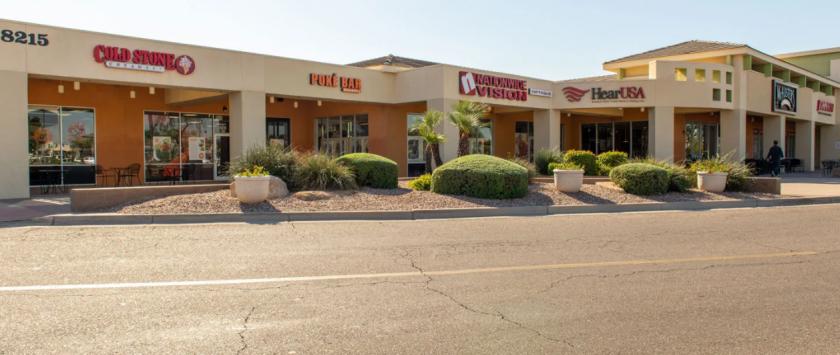
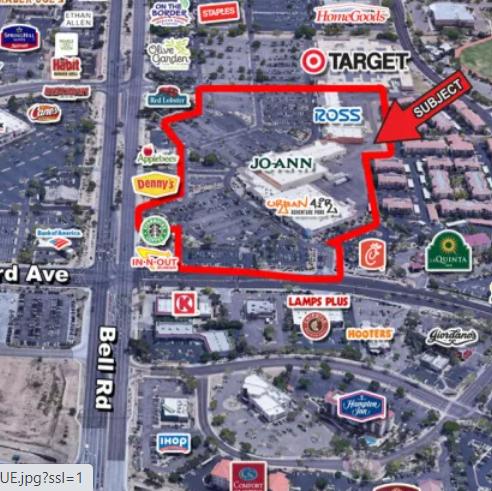
1-Mile | 3-Miles | 5-Miles | ||
---|---|---|---|---|
Total Population | 9,628 | 105,573 | 278,134 | |
Population Median Age | 37 | 44 | 44 | |
Population by Age | 0-9 Yrs | 1319 (13%) | 9841 (9%) | 27384 (9%) |
10-19 Yrs | 1213 (12%) | 11872 (11%) | 32414 (11%) | |
20-29 Yrs | 1620 (16%) | 13324 (12%) | 33048 (11%) | |
30-39 Yrs | 1234 (12%) | 10999 (10%) | 29260 (10%) | |
40-49 Yrs | 1205 (12%) | 12506 (11%) | 32611 (11%) | |
50-59 Yrs | 1136 (11%) | 14419 (13%) | 38150 (13%) | |
60-69 Yrs | 991 (10%) | 14406 (13%) | 37347 (13%) | |
70+ Yrs | 910 (9%) | 18205 (17%) | 47920 (17%) | |
Median HH Income | $65,008 | $67,411 | $61,511 | |
Total Household Income | < 24K | 577 (15%) | 6144 (14%) | 18122 (16%) |
25-49K | 782 (20%) | 9169 (21%) | 25561 (23%) | |
50-74K | 853 (22%) | 7860 (18%) | 20598 (19%) | |
75-99K | 537 (14%) | 6435 (15%) | 16235 (14%) | |
100-199K | 884 (23%) | 10215 (24%) | 23358 (21%) | |
200K+ | 159 (4%) | 2212 (5%) | 4473 (4%) | |
Highest Education Level | No Diploma | 415 | 4342 | 15523 |
Diploma or GED | 1572 | 20180 | 56239 | |
Some College | 1473 | 20896 | 54978 | |
Assoc. Degree | 698 | 7165 | 18953 | |
Bachelors Degree | 1430 | 16253 | 36907 | |
Higher Degree | 795 | 8976 | 20447 | |
Total Housing Units | 4,214 | 47,475 | 121,636 | |
--Owner-Occupied | 1,510 | 28,960 | 76,936 | |
--Renter-Occupied | 2,283 | 13,075 | 31,410 | |
Owner-Occupied Values | < 100K | 42 | 1764 | 9156 |
100-199K | 281 | 8504 | 26546 | |
200-299K | 595 | 11153 | 24255 | |
300-399K | 300 | 5212 | 10417 | |
400-499K | 218 | 1597 | 3622 | |
500K+ | 74 | 729 | 2940 | |
Total Working Age Population | 7,599 | 88,717 | 231,206 | |
In Work Force | 5,077 | 52,328 | 132,482 | |
Not In Work Force | 2,522 | 36,389 | 98,725 | |
Workforce Employed | 4,831 | 49,518 | 124,820 | |
Workforce Unemployed | 217 | 2,623 | 7,371 | |
Civlian Workforce | 5,048 | 52,140 | 132,191 | |
Military Workforce | 29 | 188 | 290 | |
Total Households | 3,793 | 42,034 | 108,347 | |
Family Households | 2,223 | 27,484 | 70,708 | |
Non-Family Households | 1,570 | 14,551 | 37,638 | |
Married Couple | 1,583 | 21,366 | 54,260 | |
Other Family | 640 | 6,117 | 16,449 | |
Married w/Child | 709 | 6,627 | 16,736 | |
Single Male w/Child | 152 | 963 | 2,450 | |
Single Female w/Child | 200 | 1,702 | 4,884 |
Population Change Last Two Decades - Plus Projection
2000 | % | 2010 | % | 2020 | % | 2030 | |
---|---|---|---|---|---|---|---|
Arizona | 5,130,632 | +25 | 6,392,017 | +14 | 7,286,100 | +14 | 8,284,900 |
Maricopa County | 3,072,149 | +24 | 3,817,117 | +16 | 4,436,900 | +15 | 5,107,700 |
Total Working Age Population:
Total Households:
Total Working Age Population:
Total Households:
Total Working Age Population:
Total Households: