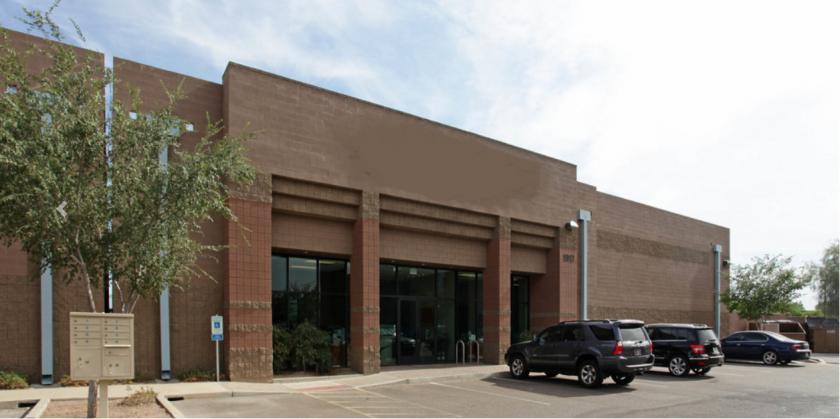
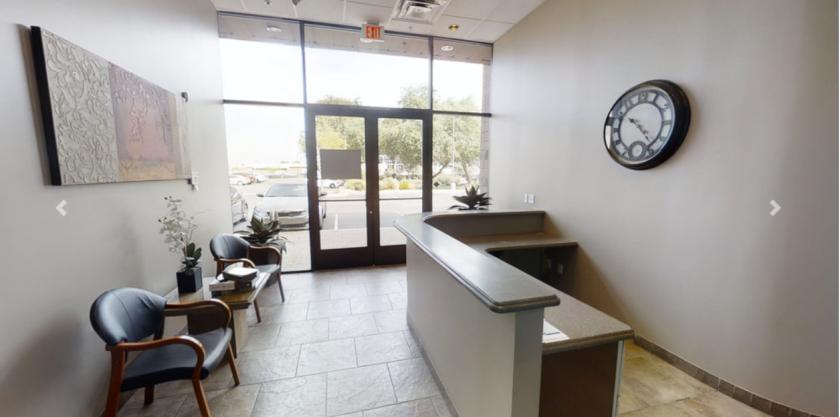
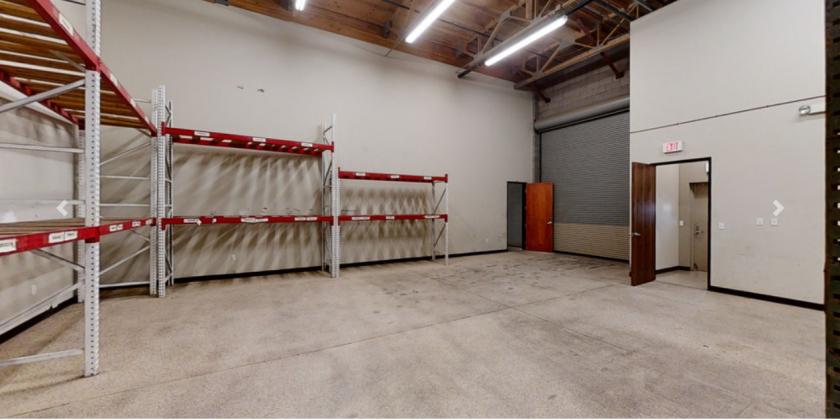
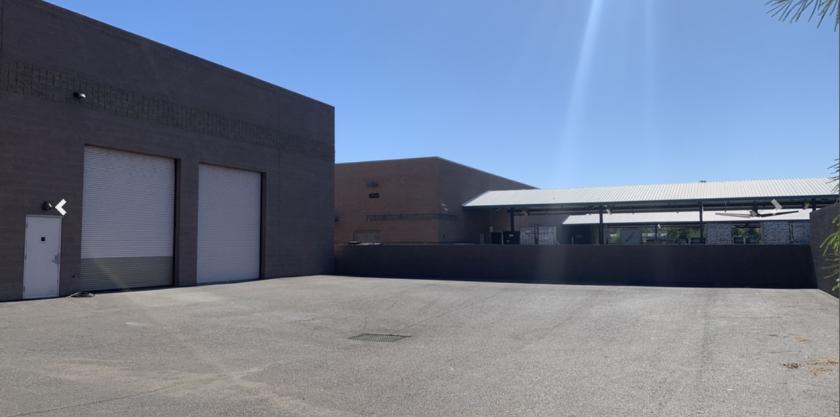
1-Mile | 3-Miles | 5-Miles | ||
---|---|---|---|---|
Total Population | 13,926 | 144,207 | 352,447 | |
Population Median Age | 29 | 33 | 35 | |
Population by Age | 0-9 Yrs | 1374 (9%) | 12620 (8%) | 37850 (10%) |
10-19 Yrs | 1701 (12%) | 20394 (14%) | 43336 (12%) | |
20-29 Yrs | 6555 (47%) | 47355 (32%) | 92597 (26%) | |
30-39 Yrs | 1635 (11%) | 20269 (14%) | 54344 (15%) | |
40-49 Yrs | 877 (6%) | 12510 (8%) | 37020 (10%) | |
50-59 Yrs | 900 (6%) | 12104 (8%) | 34941 (9%) | |
60-69 Yrs | 581 (4%) | 9566 (6%) | 27955 (7%) | |
70+ Yrs | 304 (2%) | 9389 (6%) | 24405 (6%) | |
Median HH Income | $30,207 | $41,590 | $47,006 | |
Total Household Income | < 24K | 2558 (44%) | 17151 (31%) | 35728 (25%) |
25-49K | 1560 (27%) | 14732 (26%) | 37353 (26%) | |
50-74K | 778 (13%) | 9242 (16%) | 25944 (18%) | |
75-99K | 505 (8%) | 5632 (10%) | 15666 (11%) | |
100-199K | 272 (4%) | 7072 (12%) | 20453 (14%) | |
200K+ | 29 (0%) | 1318 (2%) | 3687 (2%) | |
Highest Education Level | No Diploma | 1344 | 8872 | 26939 |
Diploma or GED | 1142 | 17220 | 46287 | |
Some College | 1745 | 21785 | 56889 | |
Assoc. Degree | 368 | 6298 | 17564 | |
Bachelors Degree | 1375 | 17511 | 47443 | |
Higher Degree | 987 | 11459 | 26852 | |
Total Housing Units | 7,039 | 62,693 | 155,659 | |
--Owner-Occupied | 929 | 18,455 | 53,127 | |
--Renter-Occupied | 4,773 | 36,692 | 85,705 | |
Owner-Occupied Values | < 100K | 289 | 4210 | 8881 |
100-199K | 483 | 5492 | 15399 | |
200-299K | 76 | 5734 | 17235 | |
300-399K | 25 | 1930 | 7875 | |
400-499K | 20 | 602 | 2240 | |
500K+ | 36 | 487 | 1496 | |
Total Working Age Population | 11,875 | 125,340 | 294,462 | |
In Work Force | 8,158 | 84,339 | 204,949 | |
Not In Work Force | 3,716 | 41,001 | 89,513 | |
Workforce Employed | 7,525 | 78,915 | 193,060 | |
Workforce Unemployed | 633 | 5,236 | 11,634 | |
Civlian Workforce | 8,158 | 84,151 | 204,694 | |
Military Workforce | 0 | 188 | 255 | |
Total Households | 5,702 | 55,147 | 138,831 | |
Family Households | 1,978 | 22,764 | 66,043 | |
Non-Family Households | 3,724 | 32,383 | 72,788 | |
Married Couple | 837 | 12,789 | 40,492 | |
Other Family | 1,142 | 9,974 | 25,552 | |
Married w/Child | 243 | 4,822 | 15,757 | |
Single Male w/Child | 177 | 1,317 | 3,562 | |
Single Female w/Child | 420 | 3,152 | 8,468 |
Population Change Last Two Decades - Plus Projection
2000 | % | 2010 | % | 2020 | % | 2030 | |
---|---|---|---|---|---|---|---|
Arizona | 5,130,632 | +25 | 6,392,017 | +14 | 7,286,100 | +14 | 8,284,900 |
Maricopa County | 3,072,149 | +24 | 3,817,117 | +16 | 4,436,900 | +15 | 5,107,700 |
Total Working Age Population:
Total Households:
Total Working Age Population:
Total Households:
Total Working Age Population:
Total Households: