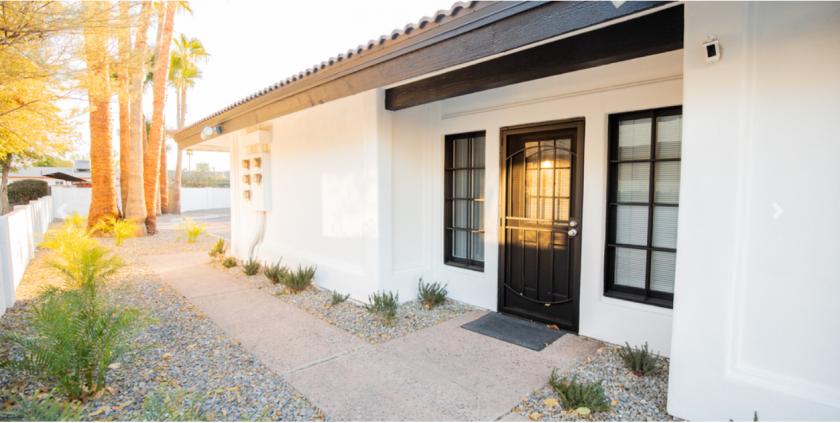
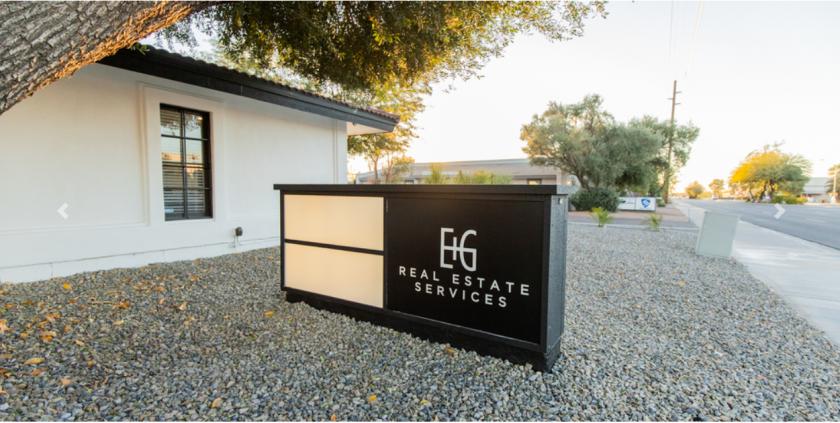
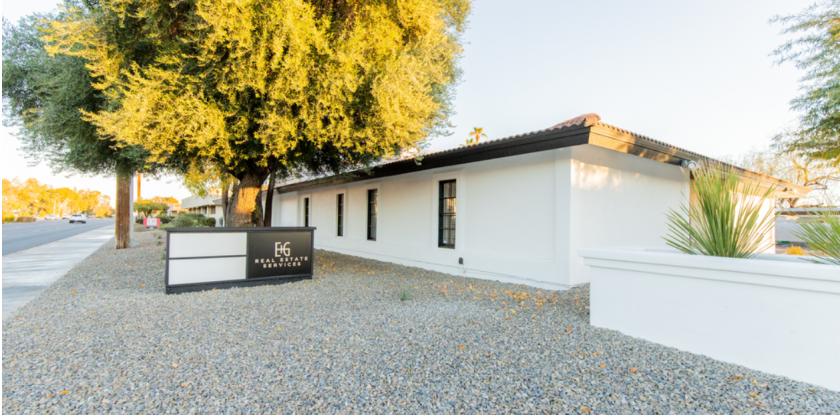
1-Mile | 3-Miles | 5-Miles | ||
---|---|---|---|---|
Total Population | 23,391 | 157,464 | 366,778 | |
Population Median Age | 32 | 33 | 35 | |
Population by Age | 0-9 Yrs | 2216 (9%) | 15377 (9%) | 40892 (11%) |
10-19 Yrs | 2838 (12%) | 22538 (14%) | 46679 (12%) | |
20-29 Yrs | 8778 (37%) | 48695 (30%) | 92933 (25%) | |
30-39 Yrs | 3103 (13%) | 21773 (13%) | 56247 (15%) | |
40-49 Yrs | 1893 (8%) | 14531 (9%) | 37736 (10%) | |
50-59 Yrs | 1999 (8%) | 13334 (8%) | 37711 (10%) | |
60-69 Yrs | 1515 (6%) | 11367 (7%) | 30295 (8%) | |
70+ Yrs | 1050 (4%) | 9848 (6%) | 24286 (6%) | |
Median HH Income | $37,221 | $43,660 | $48,659 | |
Total Household Income | < 24K | 3593 (36%) | 17106 (28%) | 34960 (24%) |
25-49K | 2654 (27%) | 16404 (27%) | 36820 (26%) | |
50-74K | 1394 (14%) | 10919 (18%) | 26956 (19%) | |
75-99K | 1064 (10%) | 6536 (10%) | 16036 (11%) | |
100-199K | 987 (10%) | 7986 (13%) | 21548 (15%) | |
200K+ | 132 (1%) | 1408 (2%) | 4047 (2%) | |
Highest Education Level | No Diploma | 1622 | 9118 | 28445 |
Diploma or GED | 2506 | 18140 | 48228 | |
Some College | 3305 | 23668 | 58862 | |
Assoc. Degree | 957 | 7206 | 18132 | |
Bachelors Degree | 3185 | 19753 | 47717 | |
Higher Degree | 1892 | 13152 | 27714 | |
Total Housing Units | 11,389 | 68,066 | 156,096 | |
--Owner-Occupied | 2,371 | 21,237 | 57,004 | |
--Renter-Occupied | 7,453 | 39,122 | 83,362 | |
Owner-Occupied Values | < 100K | 190 | 3309 | 9351 |
100-199K | 897 | 6459 | 17247 | |
200-299K | 879 | 7329 | 19052 | |
300-399K | 244 | 2774 | 7301 | |
400-499K | 75 | 706 | 2147 | |
500K+ | 85 | 660 | 1906 | |
Total Working Age Population | 19,983 | 134,193 | 303,740 | |
In Work Force | 13,523 | 91,461 | 210,842 | |
Not In Work Force | 6,460 | 42,732 | 92,899 | |
Workforce Employed | 12,697 | 85,710 | 198,232 | |
Workforce Unemployed | 823 | 5,624 | 12,349 | |
Civlian Workforce | 13,520 | 91,334 | 210,581 | |
Military Workforce | 3 | 127 | 260 | |
Total Households | 9,823 | 60,358 | 140,366 | |
Family Households | 3,849 | 27,547 | 70,848 | |
Non-Family Households | 5,974 | 32,812 | 69,518 | |
Married Couple | 2,048 | 16,355 | 43,715 | |
Other Family | 1,801 | 11,191 | 27,133 | |
Married w/Child | 776 | 6,221 | 17,211 | |
Single Male w/Child | 367 | 1,711 | 3,967 | |
Single Female w/Child | 569 | 3,688 | 8,907 |
Population Change Last Two Decades - Plus Projection
2000 | % | 2010 | % | 2020 | % | 2030 | |
---|---|---|---|---|---|---|---|
Arizona | 5,130,632 | +25 | 6,392,017 | +14 | 7,286,100 | +14 | 8,284,900 |
Maricopa County | 3,072,149 | +24 | 3,817,117 | +16 | 4,436,900 | +15 | 5,107,700 |
Total Working Age Population:
Total Households:
Total Working Age Population:
Total Households:
Total Working Age Population:
Total Households: