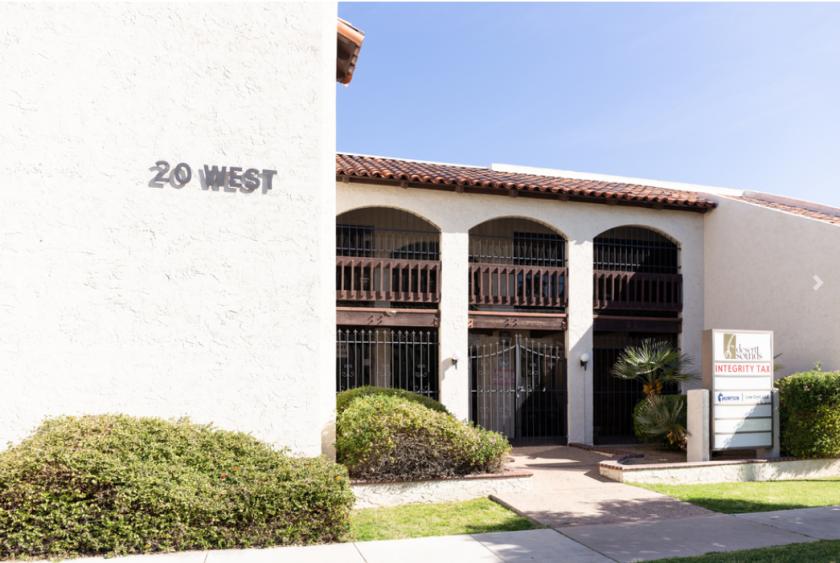
1-Mile | 3-Miles | 5-Miles | ||
---|---|---|---|---|
Total Population | 18,356 | 175,899 | 351,278 | |
Population Median Age | 35 | 33 | 35 | |
Population by Age | 0-9 Yrs | 2733 (14%) | 28883 (16%) | 49831 (14%) |
10-19 Yrs | 2526 (13%) | 24476 (13%) | 46312 (13%) | |
20-29 Yrs | 3112 (16%) | 33048 (18%) | 67574 (19%) | |
30-39 Yrs | 3059 (16%) | 27776 (15%) | 51242 (14%) | |
40-49 Yrs | 2020 (11%) | 20630 (11%) | 40560 (11%) | |
50-59 Yrs | 1921 (10%) | 18448 (10%) | 40038 (11%) | |
60-69 Yrs | 1347 (7%) | 12289 (6%) | 29936 (8%) | |
70+ Yrs | 1638 (8%) | 10349 (5%) | 25784 (7%) | |
Median HH Income | $31,578 | $40,663 | $47,996 | |
Total Household Income | < 24K | 2713 (38%) | 16942 (27%) | 30112 (23%) |
25-49K | 2364 (33%) | 20197 (32%) | 36039 (28%) | |
50-74K | 1170 (16%) | 11759 (19%) | 24010 (18%) | |
75-99K | 427 (6%) | 5650 (9%) | 14401 (11%) | |
100-199K | 340 (4%) | 5949 (9%) | 19324 (15%) | |
200K+ | 65 (0%) | 857 (1%) | 3582 (2%) | |
Highest Education Level | No Diploma | 2874 | 22248 | 32089 |
Diploma or GED | 3068 | 29154 | 53813 | |
Some College | 3077 | 27710 | 58832 | |
Assoc. Degree | 798 | 8831 | 19906 | |
Bachelors Degree | 1259 | 13532 | 39013 | |
Higher Degree | 494 | 5596 | 19023 | |
Total Housing Units | 7,793 | 67,843 | 142,534 | |
--Owner-Occupied | 1,588 | 23,136 | 61,352 | |
--Renter-Occupied | 5,493 | 38,218 | 66,116 | |
Owner-Occupied Values | < 100K | 374 | 5066 | 12112 |
100-199K | 597 | 9762 | 18702 | |
200-299K | 404 | 5976 | 18992 | |
300-399K | 122 | 1509 | 7178 | |
400-499K | 19 | 436 | 2336 | |
500K+ | 72 | 387 | 2033 | |
Total Working Age Population | 14,053 | 132,124 | 274,388 | |
In Work Force | 8,753 | 91,359 | 187,528 | |
Not In Work Force | 5,300 | 40,765 | 86,860 | |
Workforce Employed | 7,937 | 85,391 | 176,311 | |
Workforce Unemployed | 811 | 5,860 | 11,002 | |
Civlian Workforce | 8,748 | 91,251 | 187,312 | |
Military Workforce | 5 | 107 | 215 | |
Total Households | 7,081 | 61,354 | 127,468 | |
Family Households | 3,900 | 36,719 | 75,933 | |
Non-Family Households | 3,180 | 24,635 | 51,535 | |
Married Couple | 2,326 | 21,916 | 49,978 | |
Other Family | 1,575 | 14,803 | 25,955 | |
Married w/Child | 1,147 | 10,871 | 21,374 | |
Single Male w/Child | 169 | 2,204 | 4,026 | |
Single Female w/Child | 831 | 6,429 | 10,131 |
Population Change Last Two Decades - Plus Projection
2000 | % | 2010 | % | 2020 | % | 2030 | |
---|---|---|---|---|---|---|---|
Arizona | 5,130,632 | +25 | 6,392,017 | +14 | 7,286,100 | +14 | 8,284,900 |
Maricopa County | 3,072,149 | +24 | 3,817,117 | +16 | 4,436,900 | +15 | 5,107,700 |
Total Working Age Population:
Total Households:
Total Working Age Population:
Total Households:
Total Working Age Population:
Total Households: