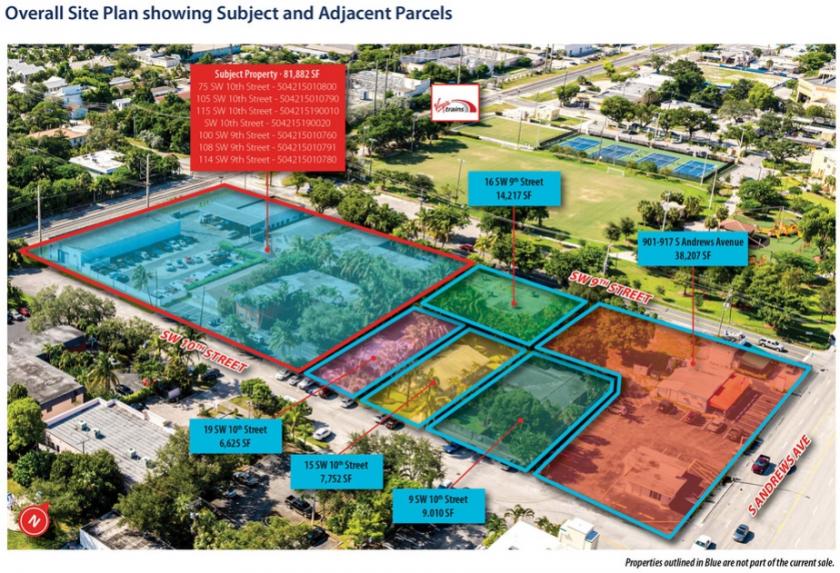
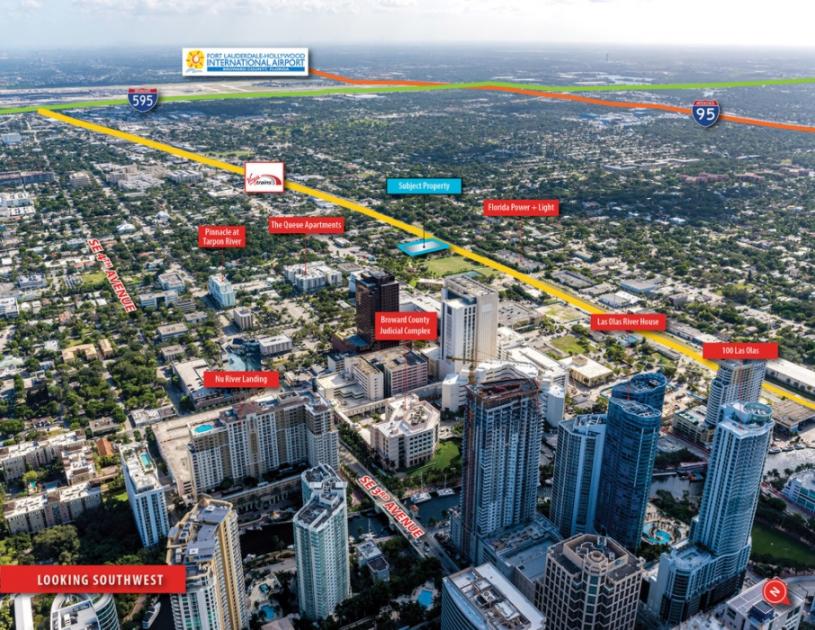
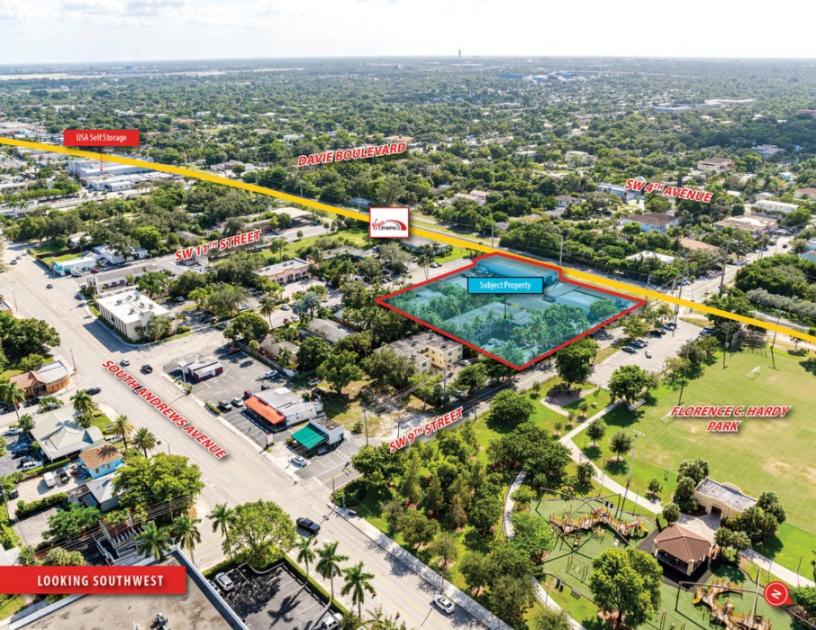
Description
The Property is within walking distance of Fort Lauderdale’s RiverWalk, boutiques, restaurants, and residences of Downtown. With a new masterplan on the way, the Downtown Fort Lauderdale CBD is becoming an area of distinctive mixed-use and pedestrian friendly neighborhoods.The in-place buildings at the property comprising 31 apartment units and a commercial lease for a garage / warehouse, generate more than $355,660 in NOI annually.
All information based on the most recently available data (updated annually) and is provided in 1-mile, 3-mile, and 5-mile radii (radiuses) of the property location.
1-Mile | 3-Miles | 5-Miles | ||
---|---|---|---|---|
Total Population | 18,406 | 123,651 | 283,789 | |
Population Median Age | 44 | 40 | 40 | |
Population by Age | 0-9 Yrs | 850 (4%) | 12652 (10%) | 33517 (11%) |
10-19 Yrs | 1040 (5%) | 12833 (10%) | 29787 (10%) | |
20-29 Yrs | 2910 (15%) | 18187 (14%) | 39127 (13%) | |
30-39 Yrs | 3166 (17%) | 19368 (15%) | 41035 (14%) | |
40-49 Yrs | 2759 (14%) | 15326 (12%) | 37043 (13%) | |
50-59 Yrs | 3393 (18%) | 19139 (15%) | 42711 (15%) | |
60-69 Yrs | 2439 (13%) | 14966 (12%) | 33136 (11%) | |
70+ Yrs | 1849 (10%) | 11180 (9%) | 27432 (9%) | |
Median HH Income | $67,992 | $52,010 | $49,867 | |
Total Household Income | < 24K | 1967 (21%) | 12458 (24%) | 27078 (25%) |
25-49K | 1575 (17%) | 11855 (23%) | 26956 (25%) | |
50-74K | 1379 (15%) | 7687 (15%) | 18529 (17%) | |
75-99K | 963 (10%) | 5154 (10%) | 11081 (10%) | |
100-199K | 2005 (22%) | 8494 (16%) | 16894 (15%) | |
200K+ | 1104 (12%) | 4331 (8%) | 7286 (6%) | |
Highest Education Level | No Diploma | 1265 | 13171 | 30328 |
Diploma or GED | 2756 | 22512 | 57210 | |
Some College | 2679 | 16477 | 37896 | |
Assoc. Degree | 1437 | 8064 | 18074 | |
Bachelors Degree | 4559 | 19849 | 39331 | |
Higher Degree | 2933 | 11629 | 22454 | |
Total Housing Units | 11,592 | 63,862 | 133,778 | |
--Owner-Occupied | 4,041 | 22,819 | 54,046 | |
--Renter-Occupied | 4,952 | 27,161 | 53,778 | |
Owner-Occupied Values | < 100K | 177 | 2065 | 7426 |
100-199K | 625 | 5074 | 14435 | |
200-299K | 673 | 4350 | 10455 | |
300-399K | 939 | 3369 | 7650 | |
400-499K | 496 | 1958 | 4064 | |
500K+ | 1131 | 6003 | 10015 | |
Total Working Age Population | 17,033 | 103,372 | 232,079 | |
In Work Force | 11,309 | 68,758 | 152,490 | |
Not In Work Force | 5,724 | 34,613 | 79,590 | |
Workforce Employed | 10,729 | 63,228 | 140,178 | |
Workforce Unemployed | 580 | 5,473 | 12,237 | |
Civlian Workforce | 11,309 | 68,701 | 152,415 | |
Military Workforce | 0 | 57 | 74 | |
Total Households | 8,993 | 49,980 | 107,823 | |
Family Households | 3,394 | 23,862 | 57,204 | |
Non-Family Households | 5,598 | 26,117 | 50,619 | |
Married Couple | 2,794 | 15,043 | 34,660 | |
Other Family | 601 | 8,819 | 22,545 | |
Married w/Child | 710 | 4,699 | 11,462 | |
Single Male w/Child | 87 | 864 | 2,067 | |
Single Female w/Child | 151 | 3,382 | 8,320 |
Population Change Last Two Decades - Plus Projection
2000 | % | 2010 | % | 2020 | % | 2030 | |
---|---|---|---|---|---|---|---|
Florida | 15,982,378 | +18 | 18,801,310 | +14 | 21,517,610 | +13 | 24,340,457 |
Broward County | 1,623,018 | +8 | 1,748,066 | +11 | 1,942,686 | +9 | 2,120,334 |
No part of this information may be copied, reproduced, repurposed, or screen-captured for any commercial purpose without prior written authorization from MyEListing.
While we strive to provide the most accurate information, all listing information, and demographic data, is provided by third-parties. As such, MyEListing will not be responsible for the accuracy of the information. It is strongly recommended that you verify all information with the listing agent, and any relevant agencies, prior to making any decisions.