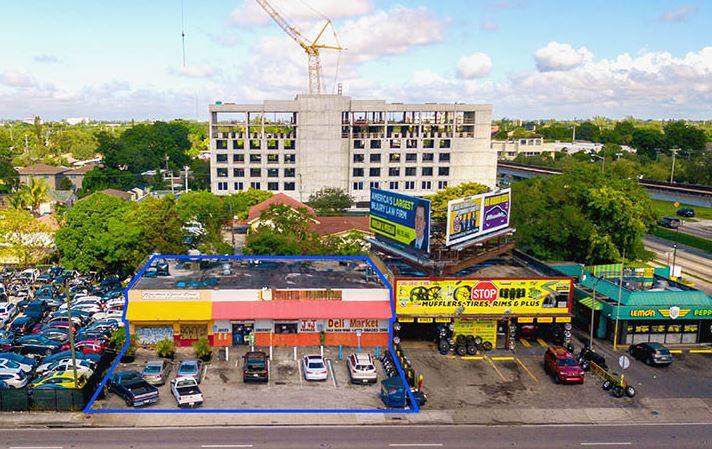
APEX Capital Realty is pleased to present the opportunity to acquire a multi-tenant retail building which sits adjacent to a signaled intersection at the highly trafficked NW 27th Avenue transit corridor. Located within a Qualified Opportunity Zone & blocks from the Brownsville METRORail Station, this property provides unique benefits for value-add in the short-term and land value in the long-term per proximity to public transit.
Property Summary
Lot Size: 9,675 Sq. Ft. (0.22 acres)
Building Size: 4,120 Sq. Ft.
Available SF: approx. 2,690 SF
Zoning: UC-MC (UC-Center Mixed-Use Corridor)
Max. Height: 12 stories
Density: 90 units per acre (19.8 on this site)
Lot Dimensions: 75? x 129? approx.
Parking: 10 spaces
ASKING PRICE: $595,000
FOR LEASE
Available Area: Approx. 2,690 SF
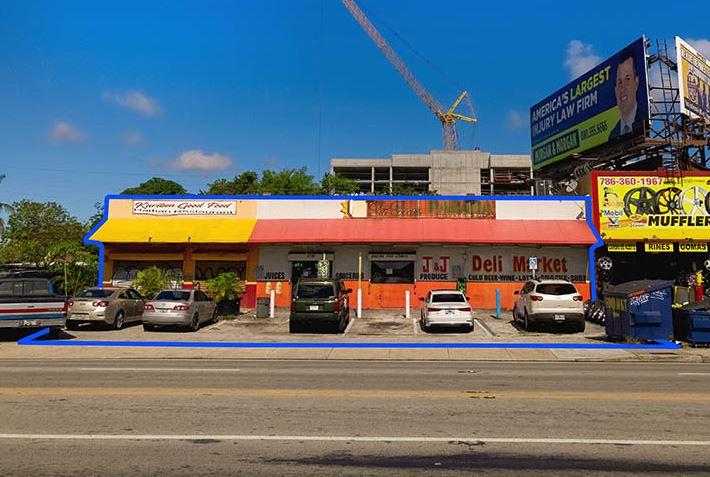
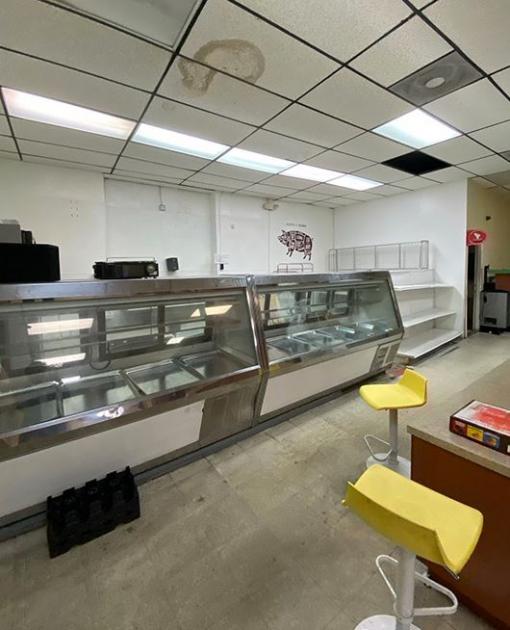
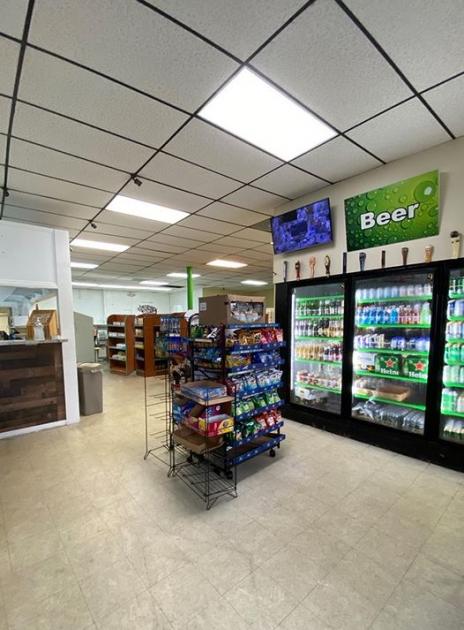
Existing Use: Market / Deli
Asking Price: $3,500/mo
Property Highlights
Contains two separate retail spaces both with full kitchens, the larger of the two was previously a convenience store/deli and is currently available for lease.
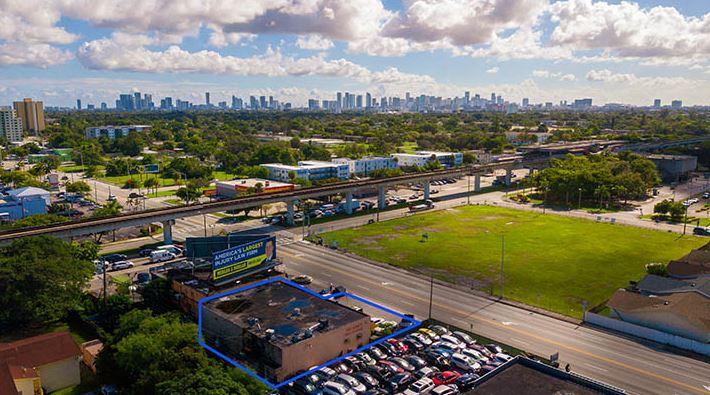
Located within a Qualified Opportunity Zone, just off NW 27th Ave in what is technically the Brownsville neighborhood, the property sits at the borders of the Westgate & Model City neighborhoods, and just to the north of Allapattah.
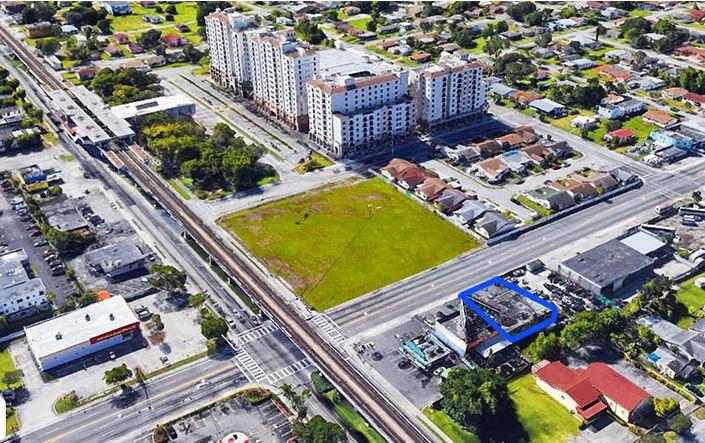
Situated along the Strategic Miami Area Rapid Transit (SMART) Corridor and only 2 blocks from the Brownsville METRORail Station to the south, and 9 blocks from the Dr. Martin Luther King Jr. Plaza METRORail Station to the north.
This site provides unique benefits toward a “Transit-Oriented Development” in the future with its height and density bonuses which are 12 stories instead of 6, and 90 units per acre instead of 60. Also allows for a 50% reduction in required parking.
This property can be sold to an owner-user looking to occupy the remaining square footage and benefit from the income from the second tenant, or an investor looking for a value-add or future development opportunity to maximize on the continuing growth of the surrounding area over time.