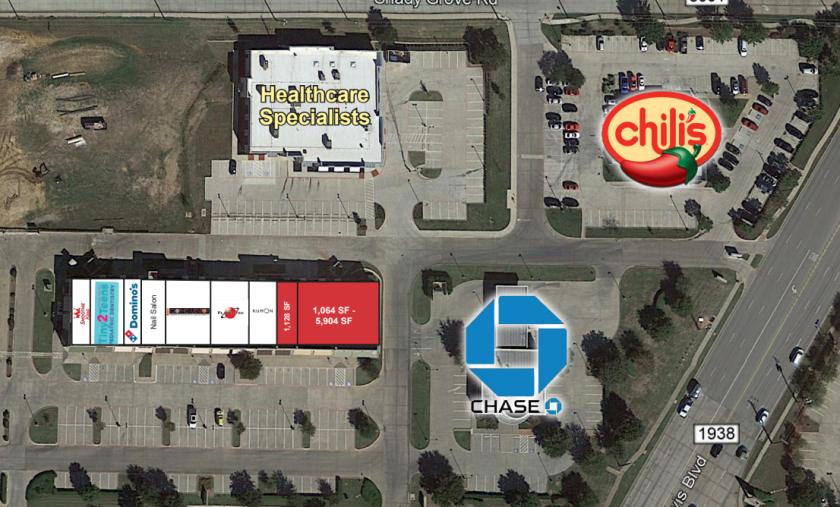
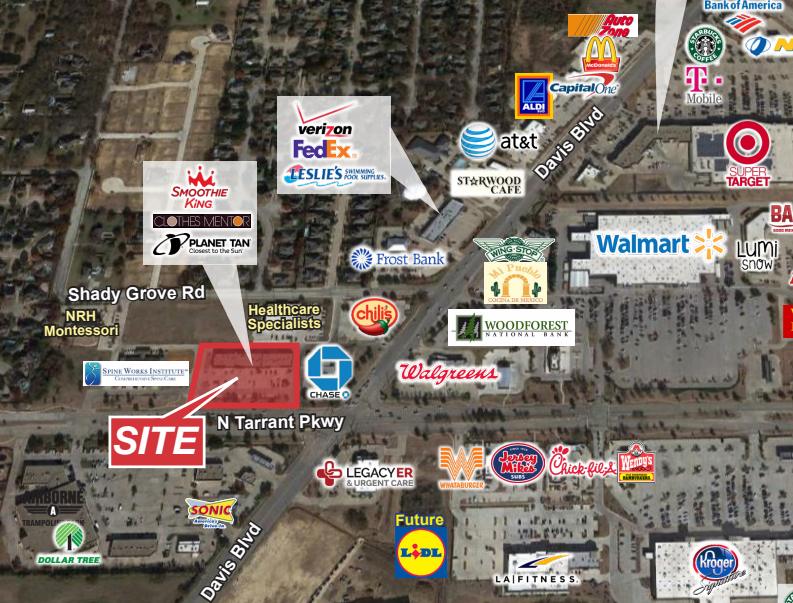
1-Mile | 3-Miles | 5-Miles | ||
---|---|---|---|---|
Total Population | 8,774 | 76,403 | 232,515 | |
Population Median Age | 39 | 39 | 38 | |
Population by Age | 0-9 Yrs | 1235 (14%) | 9933 (13%) | 31903 (13%) |
10-19 Yrs | 1255 (14%) | 11925 (15%) | 35753 (15%) | |
20-29 Yrs | 754 (8%) | 6038 (7%) | 23201 (9%) | |
30-39 Yrs | 678 (7%) | 7656 (10%) | 27856 (11%) | |
40-49 Yrs | 1332 (15%) | 11319 (14%) | 32549 (13%) | |
50-59 Yrs | 1668 (19%) | 13872 (18%) | 37360 (16%) | |
60-69 Yrs | 1125 (12%) | 9265 (12%) | 25132 (10%) | |
70+ Yrs | 727 (8%) | 6394 (8%) | 18761 (8%) | |
Median HH Income | $169,487 | $128,424 | $102,863 | |
Total Household Income | < 24K | 67 (2%) | 1361 (5%) | 6072 (7%) |
25-49K | 113 (4%) | 2417 (9%) | 10656 (13%) | |
50-74K | 260 (9%) | 3253 (12%) | 12150 (15%) | |
75-99K | 223 (8%) | 2677 (10%) | 9498 (12%) | |
100-199K | 998 (36%) | 9060 (35%) | 24826 (31%) | |
200K+ | 1101 (39%) | 7017 (27%) | 15514 (19%) | |
Highest Education Level | No Diploma | 97 | 1419 | 8149 |
Diploma or GED | 809 | 7661 | 26580 | |
Some College | 920 | 10506 | 34471 | |
Assoc. Degree | 442 | 4060 | 12179 | |
Bachelors Degree | 2343 | 18237 | 47640 | |
Higher Degree | 1317 | 9605 | 24405 | |
Total Housing Units | 2,857 | 26,465 | 81,364 | |
--Owner-Occupied | 2,670 | 22,824 | 62,635 | |
--Renter-Occupied | 91 | 2,962 | 16,080 | |
Owner-Occupied Values | < 100K | 43 | 632 | 3776 |
100-199K | 93 | 3962 | 17158 | |
200-299K | 403 | 5214 | 13408 | |
300-399K | 649 | 4231 | 9651 | |
400-499K | 721 | 3501 | 6694 | |
500K+ | 762 | 5283 | 11950 | |
Total Working Age Population | 6,611 | 58,915 | 177,784 | |
In Work Force | 4,478 | 40,015 | 122,524 | |
Not In Work Force | 2,133 | 18,900 | 55,260 | |
Workforce Employed | 4,303 | 38,610 | 117,546 | |
Workforce Unemployed | 175 | 1,373 | 4,892 | |
Civlian Workforce | 4,478 | 39,984 | 122,438 | |
Military Workforce | 0 | 31 | 86 | |
Total Households | 2,761 | 25,786 | 78,716 | |
Family Households | 2,564 | 21,837 | 63,042 | |
Non-Family Households | 198 | 3,949 | 15,673 | |
Married Couple | 2,334 | 19,272 | 52,659 | |
Other Family | 230 | 2,564 | 10,384 | |
Married w/Child | 979 | 8,417 | 23,661 | |
Single Male w/Child | 69 | 499 | 1,452 | |
Single Female w/Child | 79 | 866 | 4,384 |
Population Change Last Two Decades - Plus Projection
2000 | % | 2010 | % | 2020 | % | 2030 | |
---|---|---|---|---|---|---|---|
Texas | 20,851,820 | +21 | 25,145,561 | +18 | 29,677,668 | +18 | 34,894,452 |
Tarrant County | 1,446,219 | +25 | 1,809,034 | +19 | 2,143,755 | +17 | 2,507,170 |
Total Working Age Population:
Total Households:
Total Working Age Population:
Total Households:
Total Working Age Population:
Total Households: