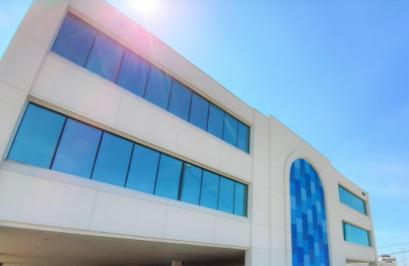
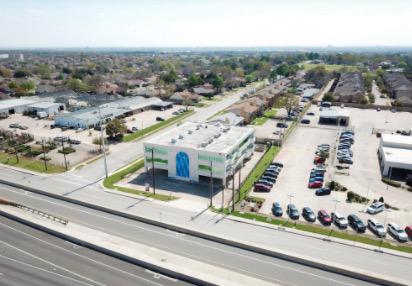
Colliers International is exclusively offering qualified investors the opportunity to purchase Airport Freeway Plaza, a two story, 20,000 square foot office investment. This building was built in 1998 of high-quality construction and sits on 0.74 acres. The first level features covered parking with two additional floors of office space, 10,000 square feet each. The investment offers tremendous flexibility for a potential investor: 1) the seller is willing to master lease up 50 percent 2) The property can be efficient as an owner user 3) used as a single-tenant investment, or broken up into multiple suites and leased out. This attractive asset, strategically located on one of the most heavily traversed corridors in the area, features excellent ingress and egress via Highway 183, delivering a traffic count of approximately 120,000 vehicles per day. The Property is complimented by immediate access to surrounding highways (SH-121, SH-360, I-30 and I-820) making transportation exceptionally convenient. In addition, 1601 Airport Freeway is surrounded by many national retailers including The Home Depot, Ross Dress for Less, Aldi, Sally Beauty Supply, Office Depot, Denny’s, Taco Cabana, Starbucks, Quality Inn, Motel 6, Microtel Inn & Suites, Whataburger, QuikTrip, IHOP and more. 1601 Airport Freeway is situated in a highly desirable location with high growth and many new developments in the immediate vicinity. The densely populated area has over 231,000 residents within five miles of the Property, with an average household income of $65,900. Hurst-Euless-Bedford (HEB) offers business a location that’s central to the nation —18 minutes from the Central Business District in Fort Worth, Texas, and 23 minutes from the Dallas Central Business District. HEB offers mature business infrastructure in an accelerated climate for development. You’ll find quality small and large-track building and office space, dedicated telecommunications networks, upscale retail, restaurant, and hotel amenities with mid-level cost-of-living and business expense averages. Dallas-Fort Worth has been among national leaders in corporate relocation, with 72 major companies moving there since 2010. The Dallas-Fort Worth Metroplex is, by population, the largest metropolitan area in Texas, the largest in the South, and the fourth largest in the United States and is leading the job market industry among the nation’s largest metropolitan areas, with a growth rate of 4.8 percent, while unemployment is safely below the national average, at 3.7 percent. Airport Freeway Plaza offers an excellent value-add opportunity. It is ideal for an investor looking to acquire a high-end development located on the main corridor at the center of a high amenity submarket in a rapidly developing area. Texas an income tax free state, providing additional benefits for investment.