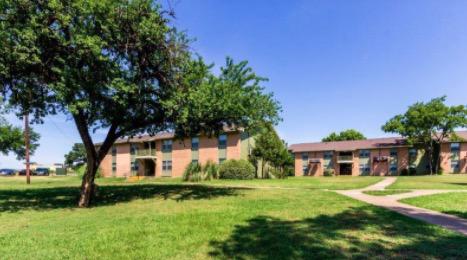
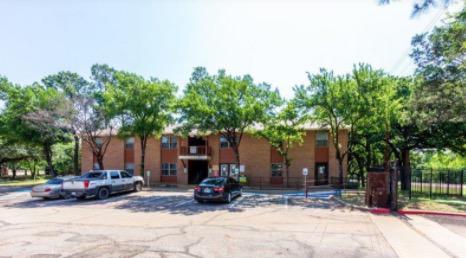
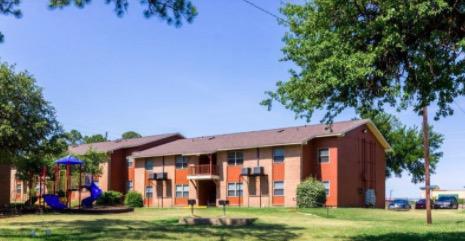
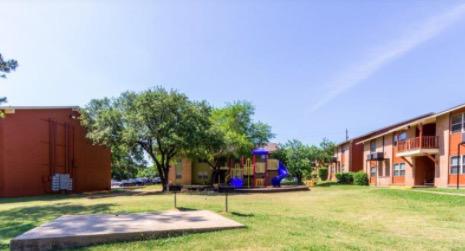
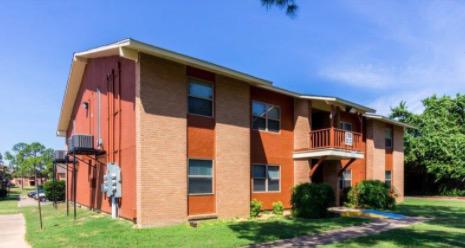
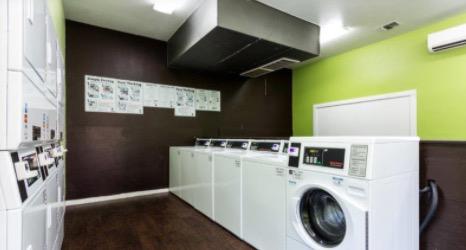
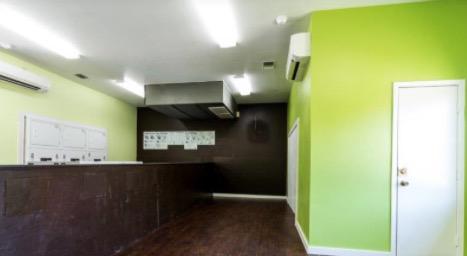
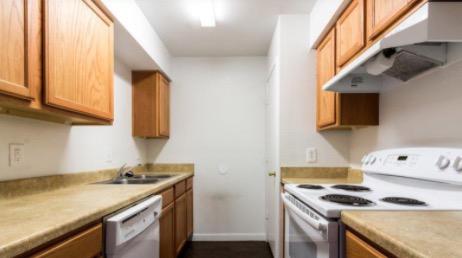
Ridge at Trinity Apartments is a 232-unit, class C, Affordable Low Income Tax Credit (“LIHTC”) multifamily asset located at 7203 Loop12 in Dallas, Texas. Built in 1970 and renovated between 2015-2019, the property is only nine miles from Downtown Dallas and provideseasy access to highway US-175, parks, retailers, and restaurants. The property has 19 buildings spread out on 17.46 acres. The buildings are built with stucco and brick exteriors, concrete slabfoundations, iron perimeter fencing, asphalt parking lot, mature tall trees and shrubs. Common area amenities include but not limited to24/7 on-site laundry facility and maintenance, on-site leasing office, and open lawn areas with two playgrounds. With an ideal unit mix of 90 percent two and three bedrooms perfectly suitable for familie, the three various one to three bedroomfloorplans range in size from 676 square feet to 1,117 square feet, averaging at 914 square feet. Unit amenities include but not limited togarbage disposals, private balconies and patios in select units, frost free refrigerators, ceiling fans, tile floors in select units, andhigh-speed internet access. Ridge at Trinity Apartments is subject to Section 42 Low Income Housing Tax Credit (“LIHTC”) program which requires reserving 143units for residents with incomes at 50 and 60 percent of Area Median Income (AMI). The property is presently in its extended useperiod set to expire December 31, 2038. Ridge at Trinity Apartments offers an affordable rent per bond regulatory agreement via Low Income Housing Tax Credit originallyawarded in 2006 at four percent. A new investor can potentially qualify for a new Four Percent Tax Credit according to representativesat the Texas Department of Housing & Community Affairs (TDHCA).