Industrial Properties
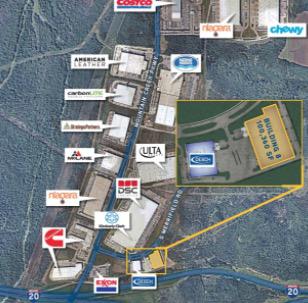
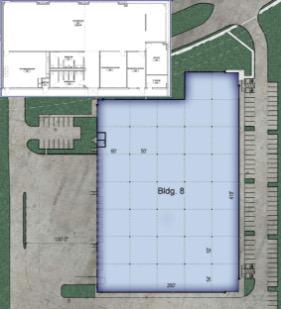
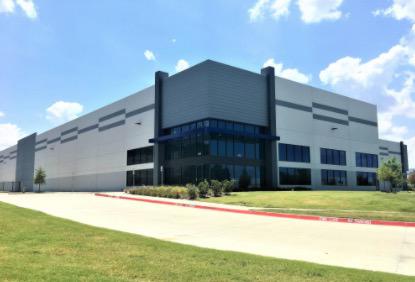
4910 Merrifield Rd Dallas, TX 75236
4910 Merrifield Rd Dallas, TX 75236
Details & Description
Listing Agents

Chris Teesdale
O: 214-217-3322
M: 121-467-6332
chris.teesdale@colliers.com
O: 214-217-3322
M: 121-467-6332
chris.teesdale@colliers.com

Tom Pearson
O: 214-217-1277
M: 214-676-2477
tom.pearson@colliers.com
O: 214-217-1277
M: 214-676-2477
tom.pearson@colliers.com
While we strive to provide the most accurate information, all listing information, and demographic data, is provided by third-parties. As such, MyEListing will not be responsible for the accuracy of the information. It is strongly recommended that you verify all information with the listing agent, and any relevant agencies, prior to making any decisions.