Industrial Properties
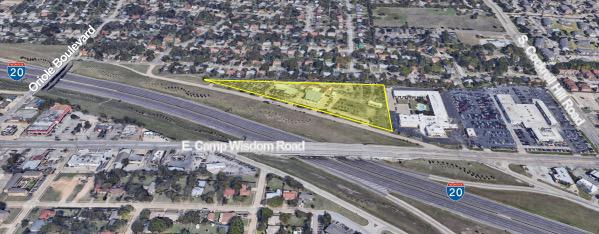
611 E INTERSTATE 20 Duncanville, TX 75116
611 E INTERSTATE 20 Duncanville, TX 75116
Details & Description
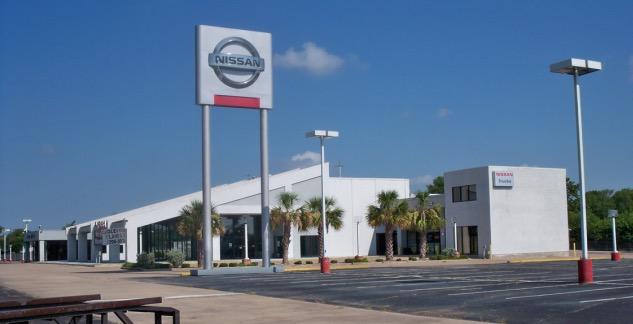
Additional Photos


Listing Agents

David Guinn
O: 214-526-3626
M: 940-550-8618
dguinn@db2re.com
O: 214-526-3626
M: 940-550-8618
dguinn@db2re.com
While we strive to provide the most accurate information, all listing information, and demographic data, is provided by third-parties. As such, MyEListing will not be responsible for the accuracy of the information. It is strongly recommended that you verify all information with the listing agent, and any relevant agencies, prior to making any decisions.