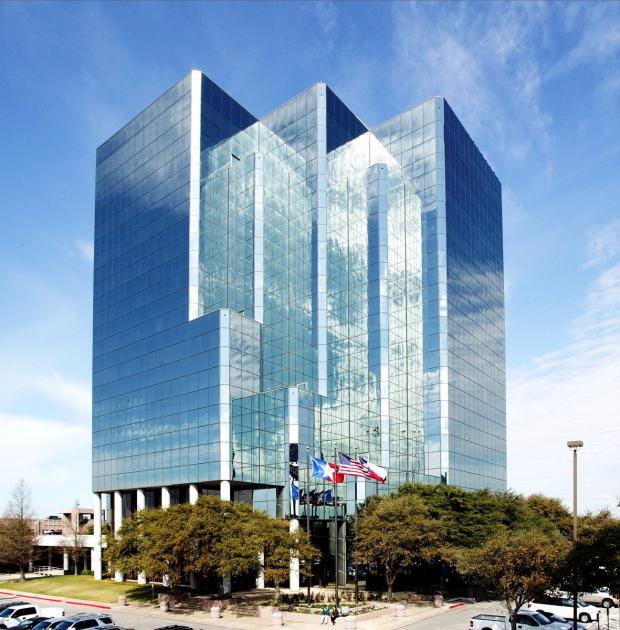
Office Space
Vega Dr. San Antonio, TX 78229
Vega Dr. San Antonio, TX 78229
Details & Description
Property Highlights
- • Move-in ready space for immediate occupancy
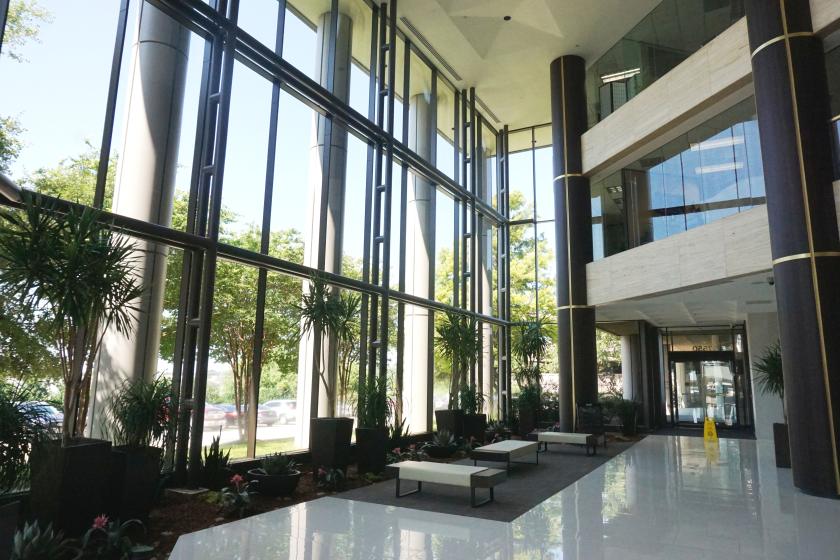
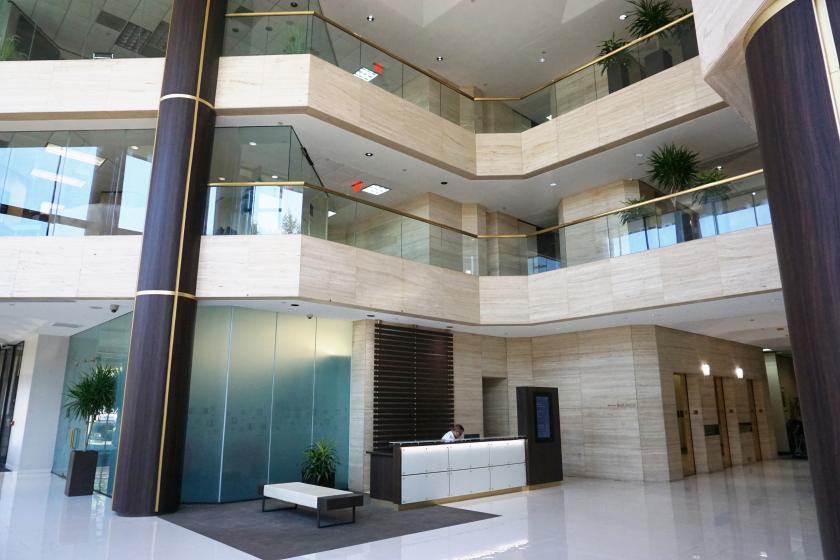
- • Lobby and common areas recently updated
- • On-site cafe
- • Building conference room with coffee bar
- • Pylon signage available
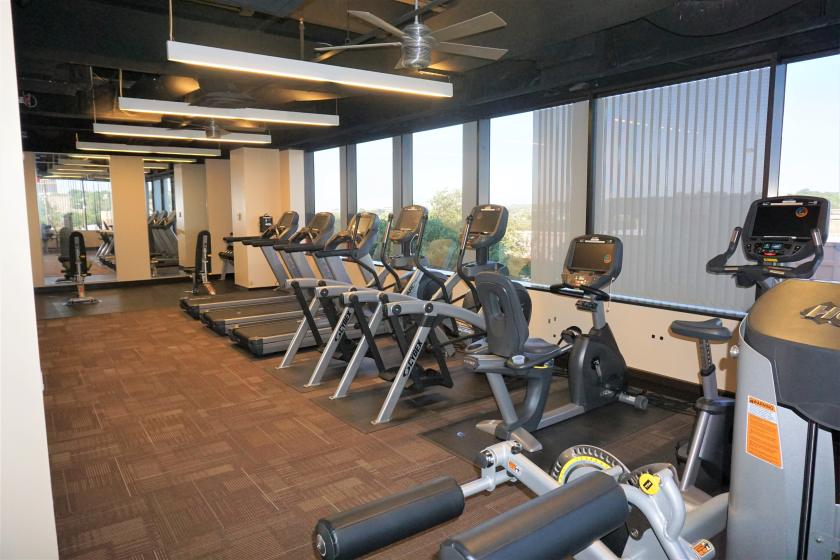
Additional Photos
Listing Agents

Paul Barker
M: 210-601-8127
pbarker@endurasa.com
M: 210-601-8127
pbarker@endurasa.com

Hayley Ruggles
M: 210-710-4722
hruggles@endurasa.com
M: 210-710-4722
hruggles@endurasa.com
While we strive to provide the most accurate information, all listing information, and demographic data, is provided by third-parties. As such, MyEListing will not be responsible for the accuracy of the information. It is strongly recommended that you verify all information with the listing agent, and any relevant agencies, prior to making any decisions.


