Property Subtypes: Office Building
Lease Rate: $29 - 31 PSF (Annual)
Lease Types: Full Service
Class of Space: Class A
Overview/Comments:
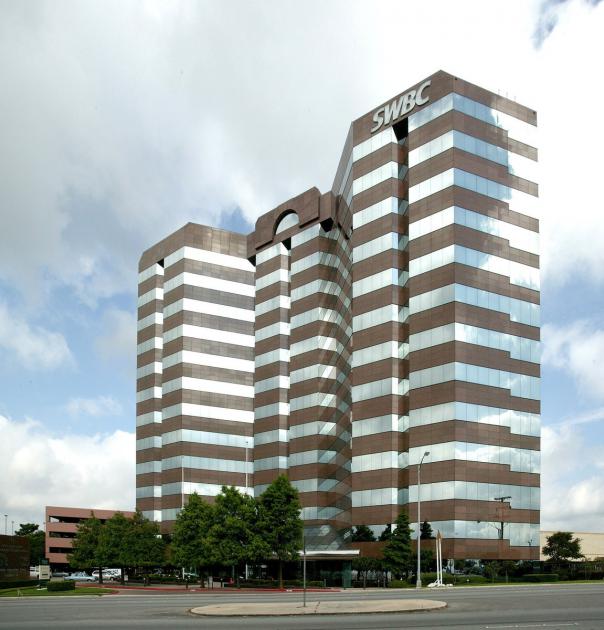
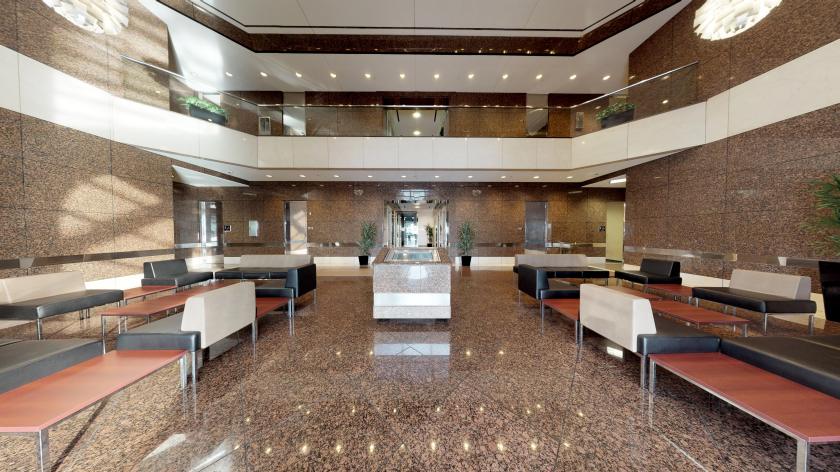
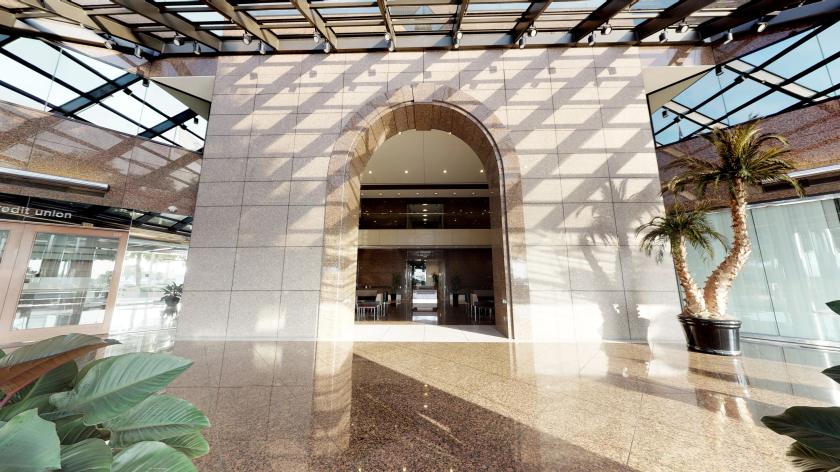
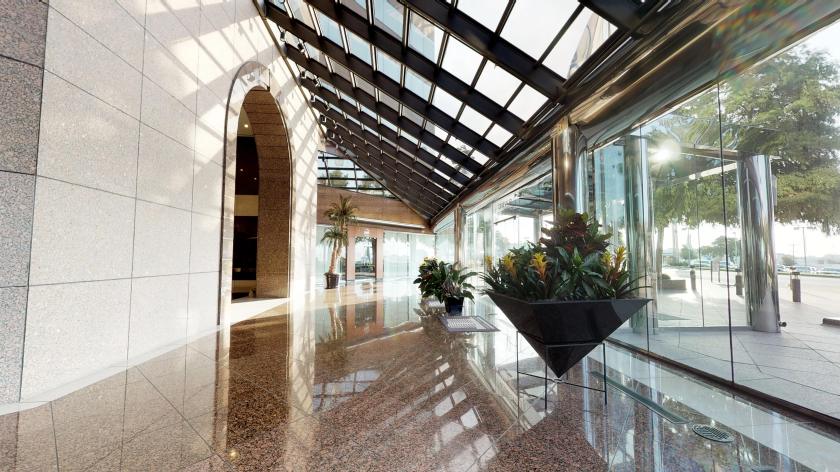
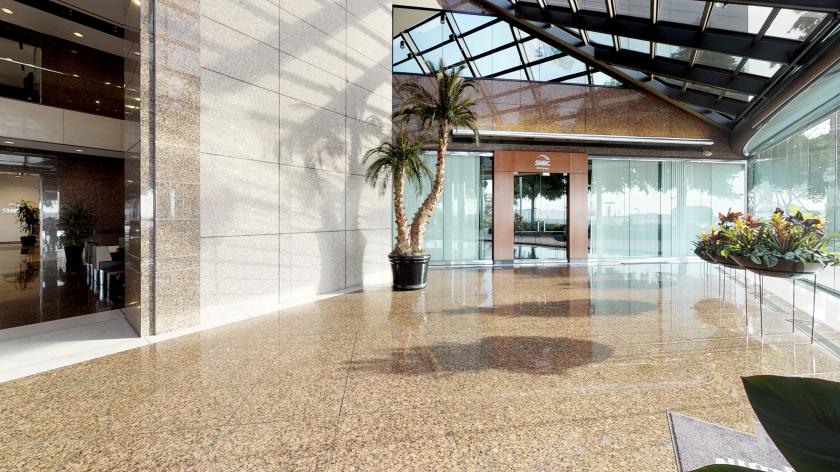
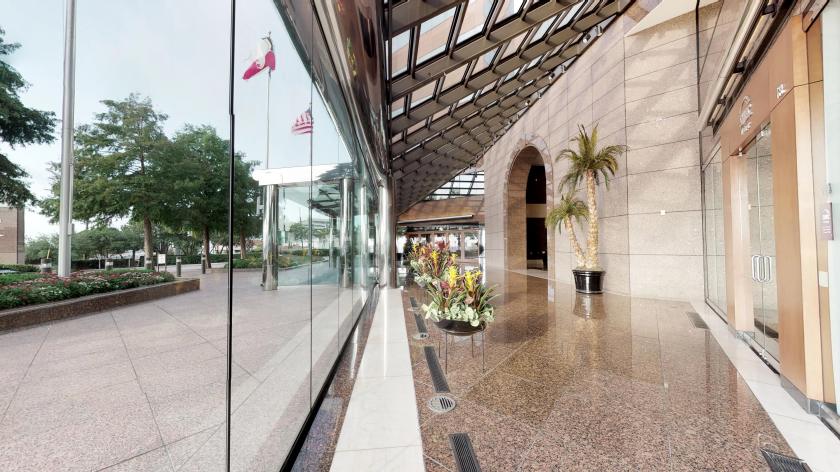
SWBC Tower has been a North San Antonio landmark since its opening. It has played host to some of the area’s most prestigious corporations. The SWBC Tower is known for quality, location, amenities and service.
Class A office building with 236,415 SF
Prime North Central location
Five minutes from San Antonio International Airport
Convenient to North Star Mall and area dining
Locally owned and occupied
On-site deli
No part of this information may be copied, reproduced, repurposed, or screen-captured for any commercial purpose without prior written authorization from MyEListing.
While we strive to provide the most accurate information, all listing information, and demographic data, is provided by third-parties. As such, MyEListing will not be responsible for the accuracy of the information. It is strongly recommended that you verify all information with the listing agent, and any relevant agencies, prior to making any decisions.
What is the asking price for 9311 San Pedro Ave in San Antonio?
The asking price for 9311 San Pedro Ave is $29.00 - $31.00 a SF per Year
What is the building size of this commercial Office property?
The size of this multi-unit property varies between 1578 - 37330 square feet
What kind of Office is the propery at 9311 San Pedro Ave?
The property at 9311 San Pedro Ave San Antonio, TX 78216 is listed as a Professional Office property
What is the population within 1 mile of 9311 San Pedro Ave in San Antonio?
The population within 1 mile of 9311 San Pedro Ave San Antonio, TX 78216 is 12,046 people.
Who do I contact for questions about 9311 San Pedro Ave?
You should contact the listing agent,
David Held, for any details regarding this commercial listing.