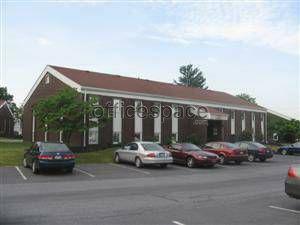
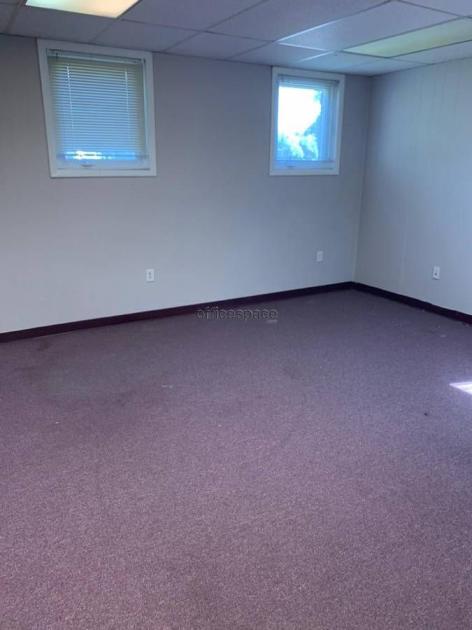
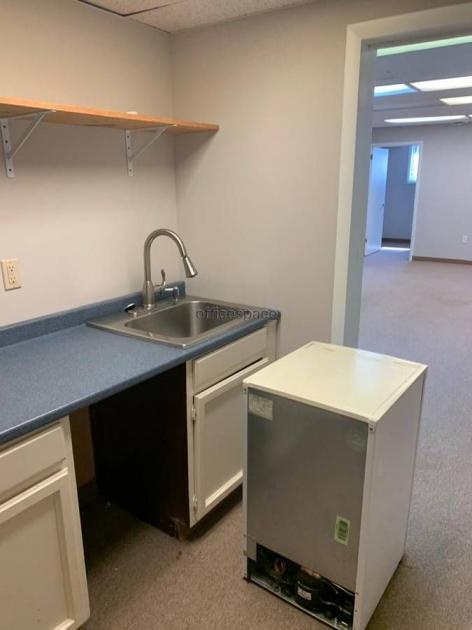
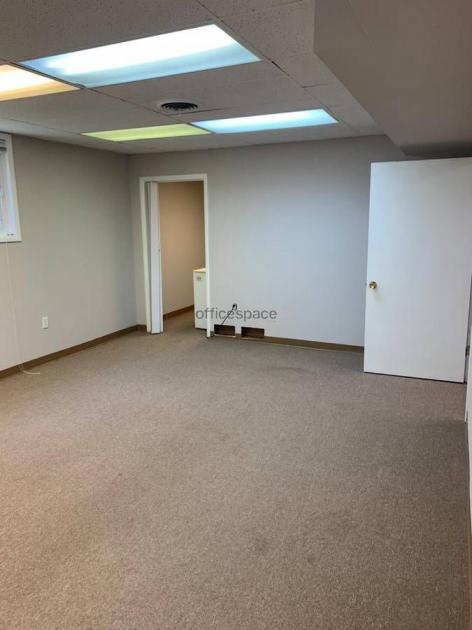
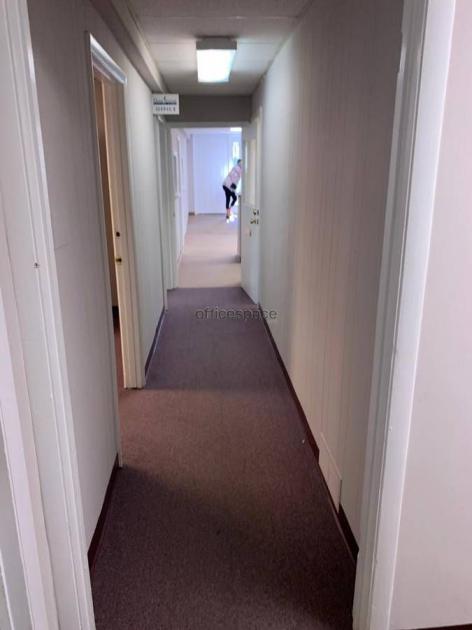
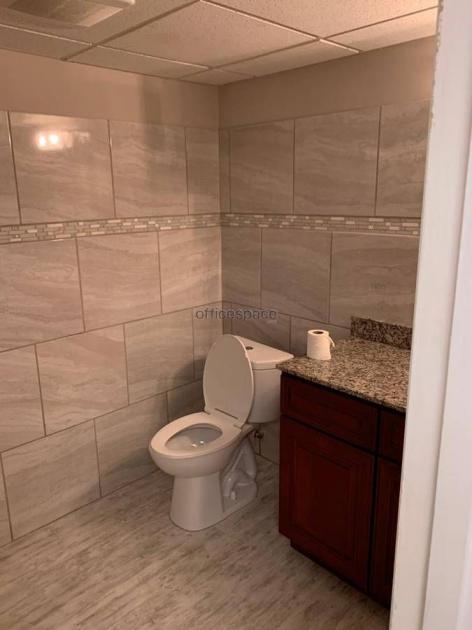
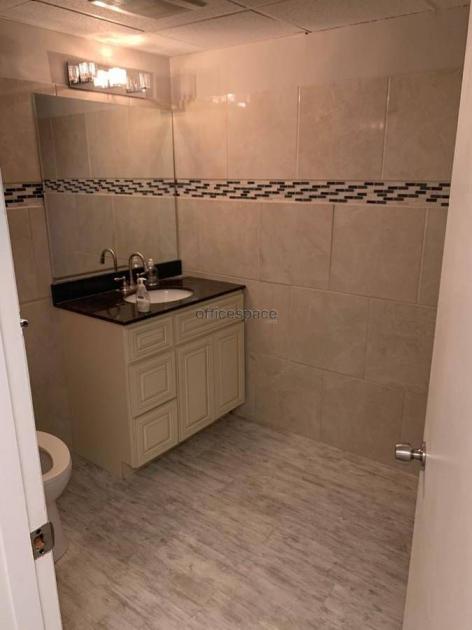
Multiple configurations possible in an office building in Mechanicsburg, PA. Location very close to Naval Base and Harrisburg, PA.Office Suites in a two-story stand alone office building available for lease near Carlisle park / Rt 581 Exit just off the Carlisle Pike in Mechanicsburg, PA. Easy highway access. Ample on-site parking. Close proximity to all major local amenities. All utilities included. Heat: electric heat pump. Restrooms: 2 per floor. A/C: central air. Ideal for small office/someone just starting or willing to relocate to a prime address. Some configurations possibilities as below:1500 sq ft office space for around $1600 per month - Has a waiting area, reception area, small working kitchen, separate entrance, Handicap accessible, large conference room, 4 office suites/rooms, two common restrooms. 3000 sq ft office space for around $3200 per month - Has a waiting area, reception area, office kitchen with dishwasher, separate entrance, Handicap accessible, large conference room, multiple office suites/rooms, built in cabinets for papers and files, two restrooms.450 sq ft office space for around $750 per month - Has a waiting area, reception area, separate entrance, Handicap accessible, two common restrooms. Ideal for small office, 3 office suites/rooms.500 sq ft office space for around $850 per month - Has a waiting area, reception area, separate entrance, Handicap accessible, small kitchen, 1 large room, 2 additional office suites/rooms, two common restrooms. Ideal for small office/doctor's office.300 sq ft office space for around $400 per month - Common kitchen, two common restrooms, 2 room office suite.