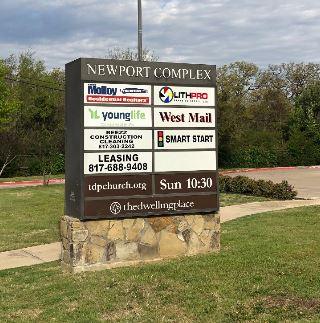
Industrial Properties
2805 W Arkansas Ln Arlington, TX 76016
2805 W Arkansas Ln Arlington, TX 76016

Details & Description
Property Highlights
- • Professional Business Park
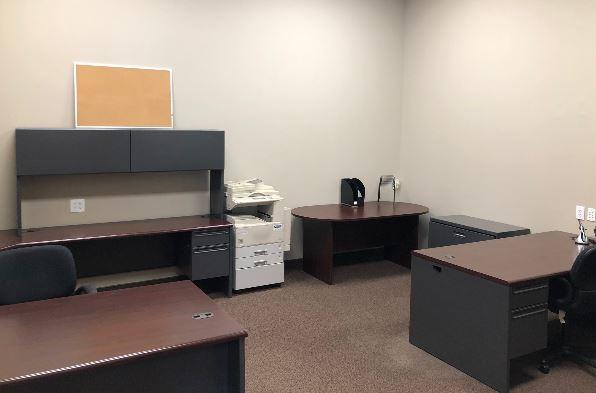
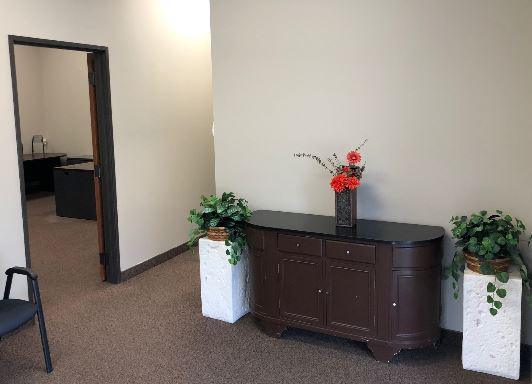
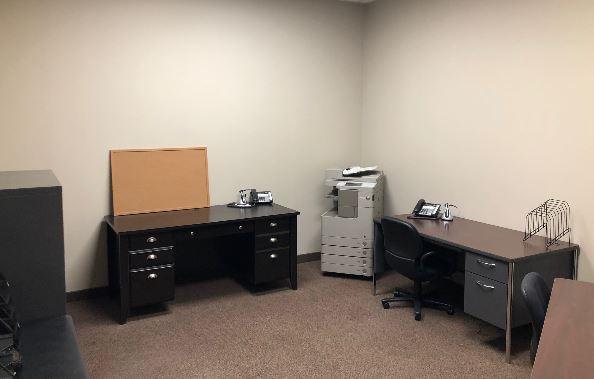
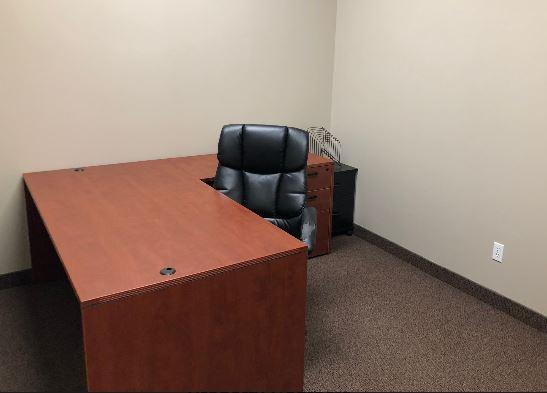
- • Move-In Ready Suites
- • No Expense Pass Through
- • Strong Local Ownership
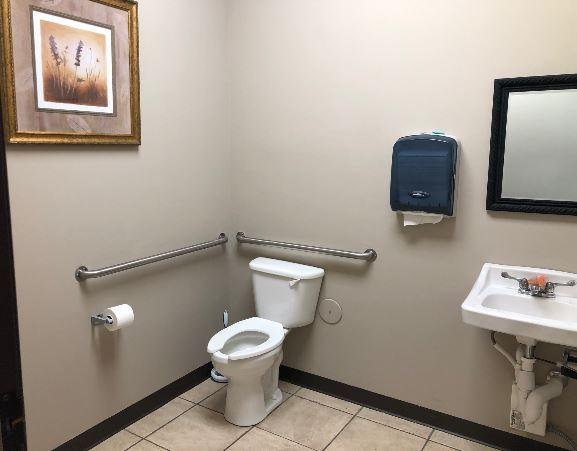
Additional Photos
Listing Agents

JP Humphrey III
O: 817-436-1067
M: 817-716-5393
jphumphrey@advisorstx.com
O: 817-436-1067
M: 817-716-5393
jphumphrey@advisorstx.com
While we strive to provide the most accurate information, all listing information, and demographic data, is provided by third-parties. As such, MyEListing will not be responsible for the accuracy of the information. It is strongly recommended that you verify all information with the listing agent, and any relevant agencies, prior to making any decisions.