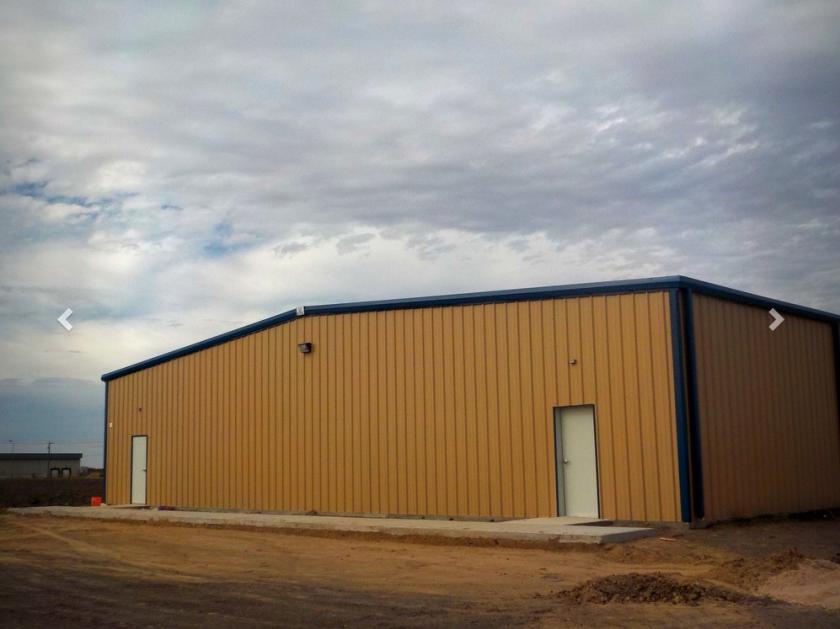
1-Mile | 3-Miles | 5-Miles | ||
---|---|---|---|---|
Total Population | 1,174 | 18,565 | 74,627 | |
Population Median Age | 28 | 34 | 35 | |
Population by Age | 0-9 Yrs | 276 (23%) | 3393 (18%) | 13545 (18%) |
10-19 Yrs | 227 (19%) | 3007 (16%) | 11820 (15%) | |
20-29 Yrs | 205 (17%) | 2727 (14%) | 9869 (13%) | |
30-39 Yrs | 162 (13%) | 2319 (12%) | 9647 (12%) | |
40-49 Yrs | 121 (10%) | 2001 (10%) | 8185 (10%) | |
50-59 Yrs | 69 (5%) | 1750 (9%) | 7236 (9%) | |
60-69 Yrs | 59 (5%) | 1557 (8%) | 7100 (9%) | |
70+ Yrs | 56 (4%) | 1811 (9%) | 7224 (9%) | |
Median HH Income | $31,408 | $43,437 | $34,917 | |
Total Household Income | < 24K | 155 (41%) | 1718 (29%) | 9018 (37%) |
25-49K | 102 (27%) | 1519 (26%) | 6315 (26%) | |
50-74K | 66 (17%) | 931 (16%) | 3498 (14%) | |
75-99K | 27 (7%) | 579 (9%) | 2015 (8%) | |
100-199K | 19 (5%) | 921 (15%) | 2531 (10%) | |
200K+ | 2 (0%) | 146 (2%) | 373 (1%) | |
Highest Education Level | No Diploma | 164 | 2075 | 12662 |
Diploma or GED | 131 | 2993 | 13652 | |
Some College | 133 | 2147 | 8004 | |
Assoc. Degree | 53 | 1192 | 3518 | |
Bachelors Degree | 64 | 1668 | 4338 | |
Higher Degree | 24 | 728 | 2322 | |
Total Housing Units | 421 | 6,977 | 27,579 | |
--Owner-Occupied | 88 | 3,063 | 13,503 | |
--Renter-Occupied | 282 | 2,752 | 10,247 | |
Owner-Occupied Values | < 100K | 51 | 1535 | 9103 |
100-199K | 26 | 1099 | 3512 | |
200-299K | 7 | 280 | 545 | |
300-399K | 4 | 134 | 202 | |
400-499K | 0 | 4 | 51 | |
500K+ | 0 | 11 | 90 | |
Total Working Age Population | 780 | 13,384 | 53,935 | |
In Work Force | 478 | 7,830 | 30,010 | |
Not In Work Force | 303 | 5,554 | 23,926 | |
Workforce Employed | 441 | 7,281 | 27,835 | |
Workforce Unemployed | 37 | 542 | 2,166 | |
Civlian Workforce | 478 | 7,823 | 30,002 | |
Military Workforce | 0 | 7 | 8 | |
Total Households | 371 | 5,815 | 23,750 | |
Family Households | 256 | 4,242 | 17,176 | |
Non-Family Households | 115 | 1,573 | 6,574 | |
Married Couple | 133 | 2,774 | 10,453 | |
Other Family | 123 | 1,467 | 6,723 | |
Married w/Child | 66 | 1,187 | 4,605 | |
Single Male w/Child | 9 | 192 | 876 | |
Single Female w/Child | 83 | 791 | 3,091 |
Population Change Last Two Decades - Plus Projection
2000 | % | 2010 | % | 2020 | % | 2030 | |
---|---|---|---|---|---|---|---|
Texas | 20,851,820 | +21 | 25,145,561 | +18 | 29,677,668 | +18 | 34,894,452 |
Cameron County | 335,227 | +21 | 406,220 | +5 | 427,881 | +2 | 438,143 |
Total Working Age Population:
Total Households:
Total Working Age Population:
Total Households:
Total Working Age Population:
Total Households: