Commercial Land
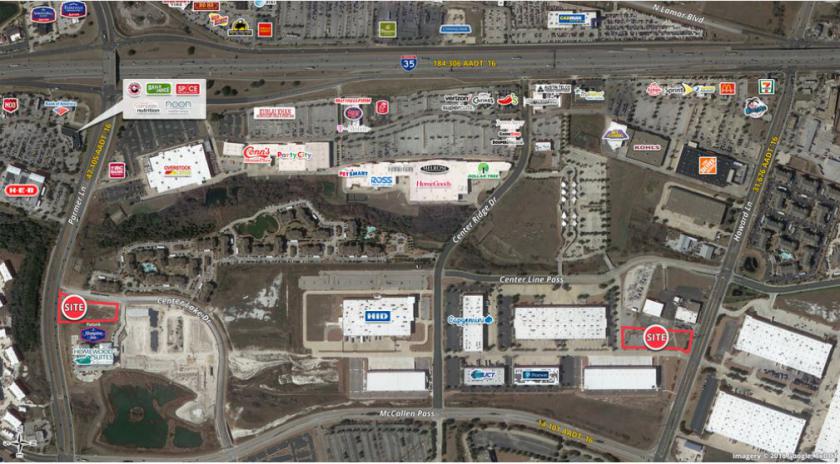
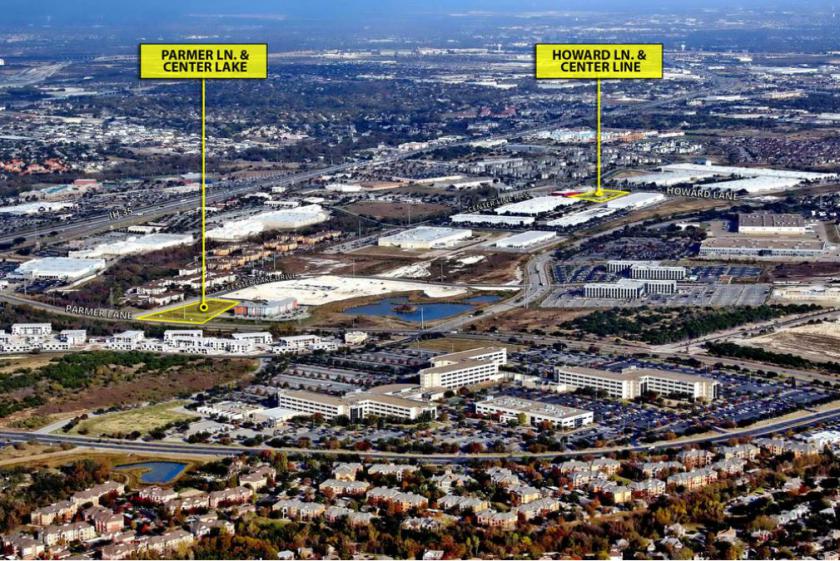
Center Lake Drive Austin, TX 78753
Center Lake Drive Austin, TX 78753
Details & Description
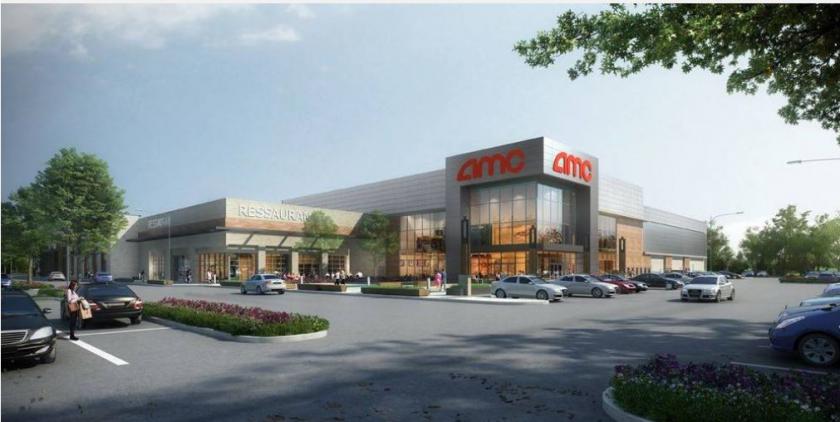
Additional Photos


Listing Agents

Alison Barnwell
O: 512-236-4603
alison.barnwell@srsre.com
O: 512-236-4603
alison.barnwell@srsre.com

T.J. Powell
O: 512-820-5174
tj@vpgre.com
O: 512-820-5174
tj@vpgre.com
While we strive to provide the most accurate information, all listing information, and demographic data, is provided by third-parties. As such, MyEListing will not be responsible for the accuracy of the information. It is strongly recommended that you verify all information with the listing agent, and any relevant agencies, prior to making any decisions.


