OVERVIEW
For more than 25 years, Texan Eye has provided cataract surgery, LASIK, and ophthalmology services for residents of Central Texas. In fact, more Central Texans choose Texan Eye for their vision needs than any other practice in the region.
Their experienced providers have made Texan Eye the vision treatment and correction practice of choice in Austin as well as Cedar Park. Among a variety of surgical treatments for cataracts, glaucoma, and other vision problems, they also have the most experienced LASIK surgeons in Central Texas. Their LASIK eye surgeons utilize the most sophisticated refractive surgery techniques available.
Texan Eye currently has 25 ophthalmologists and optometrists serving Central Austin. Several of our eye surgeons are recognized nationally and internationally as leaders in the field of cataract and refractive surgery, and all of our doctors have received advanced training.
Texan Eye offers a full profile of eye services at our Austin and Cedar Park offices.
FEATURES
Stable Cash Flow
Long-Term NNN Lease
Numerous Nearby Amenities
Near High-Income Neighborhoods
Located Eight Minutes from Downtown Austin
PROPERTY
Property Type
Office
Sub-Type
Medical Office
RBA (sf)
10418
Floors
1
Year Built
1992
Tenancy
Single
Class
A
Construction
Masonry
Parking Type
Surface
Parking Spaces
70
Parking Ratio
6.7
Land Area (ac)
2
Zoning
GO
ABN / Parcel ID
103805
DETAILS
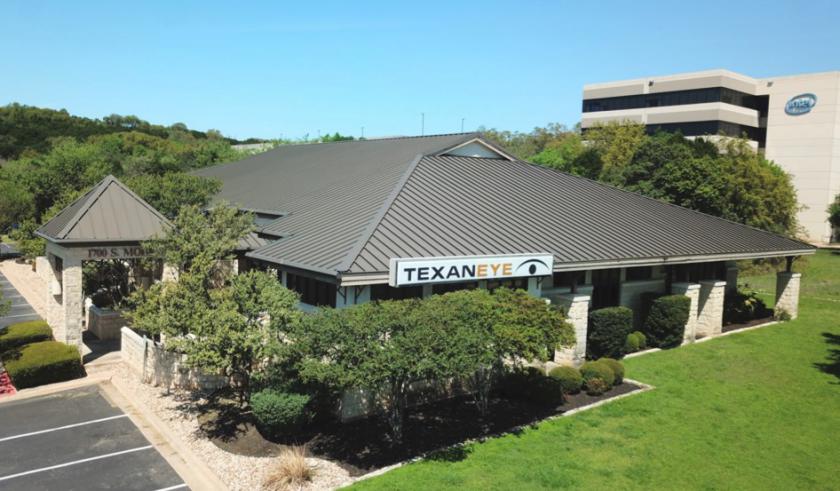
Asterra Properties is pleased to present this 10,418 SF, 100% leased Class A medical office building in the heart of Austin. The property is occupied by Texan Eye (the preferred Opthamology provider in central Texas) and has 7 years remaining on a 10 year absolute NNN lease with 2 (five year) renewal options. The tenant is responsible for the payment of taxes, insurance, utilities, repairs, maintenance, including the roof, parking, and structure, leaving minimal landlord responsibilities.
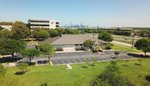
This is a rare opportunity to own a long term NNN investment in one of the fastest growing areas in the United States and offers phenomenal visibility along Mopac which is one of Austin’s most traveled corridors. Surrounded by high income neighborhoods, this property is located 8 minutes from Downtown and 16 minutes from The Domain (Austin’s second downtown).
Sale Type
Investment
Price
Contact For Pricing
Cap Rate
5.5
Occupancy
100%