Industrial Properties
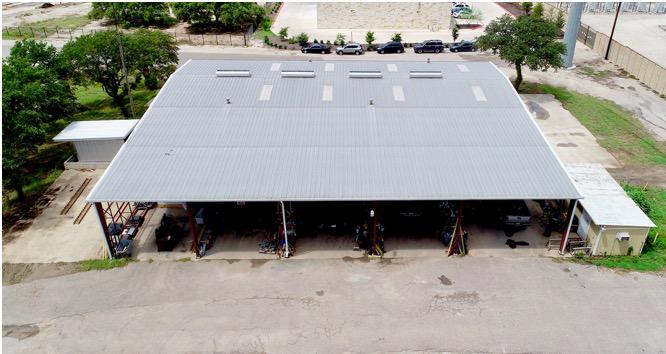
12112 Anderson Mill Rd Austin, TX 78726
12112 Anderson Mill Rd Austin, TX 78726

Details & Description
Listing Agents

Lucian Morehead
O: 512-825-6287
lmorehead@asterra.com
O: 512-825-6287
lmorehead@asterra.com
While we strive to provide the most accurate information, all listing information, and demographic data, is provided by third-parties. As such, MyEListing will not be responsible for the accuracy of the information. It is strongly recommended that you verify all information with the listing agent, and any relevant agencies, prior to making any decisions.