Retail Space
5120 E Belknap St Fort Worth, TX 76117
5120 E Belknap St Fort Worth, TX 76117
Details & Description
Property Highlights
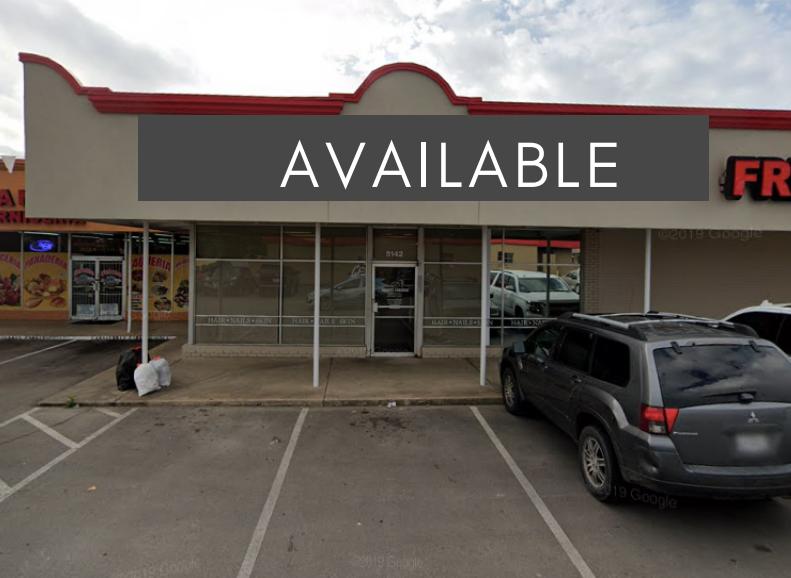
- • Located along E Belknap St
- • Great retail exposure
- • Dense Hispanic demographic
Listing Agents

Luis Pina
O: 214-987-3602
M: 214-597-7651
lpina@accentcre.com
O: 214-987-3602
M: 214-597-7651
lpina@accentcre.com

Sebastian Rodriguez
Accent CRE
O: 214-987-3602
M: 214-597-7651
sebastian@accentcre.com
Accent CRE
O: 214-987-3602
M: 214-597-7651
sebastian@accentcre.com
While we strive to provide the most accurate information, all listing information, and demographic data, is provided by third-parties. As such, MyEListing will not be responsible for the accuracy of the information. It is strongly recommended that you verify all information with the listing agent, and any relevant agencies, prior to making any decisions.