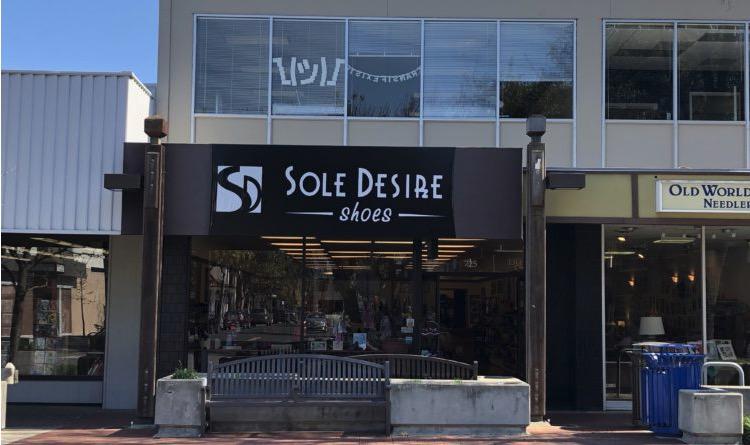
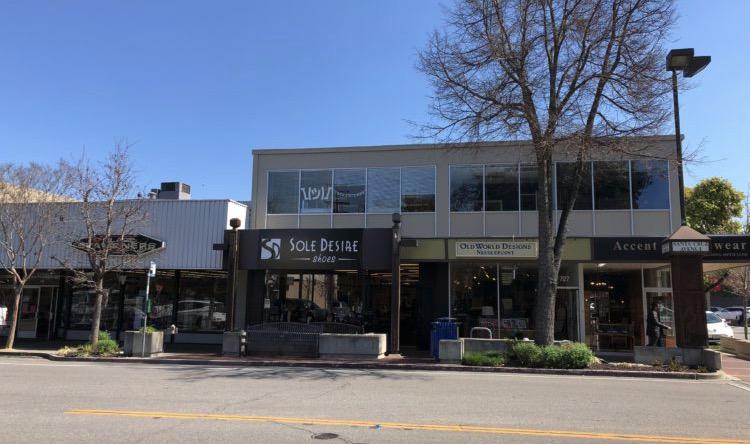
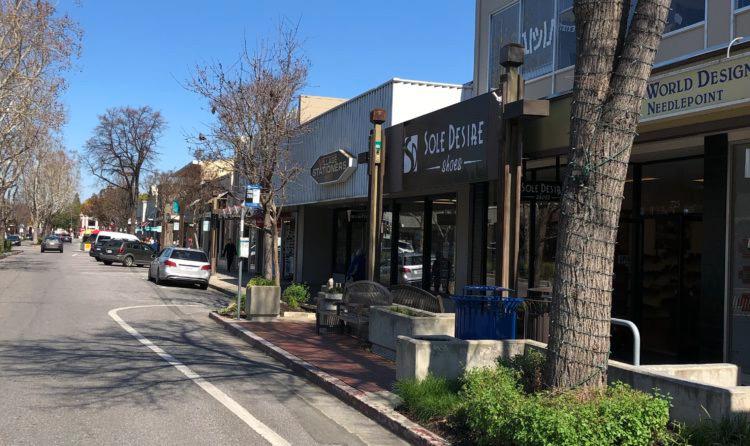
1-Mile | 3-Miles | 5-Miles | ||
---|---|---|---|---|
Total Population | 15,370 | 162,417 | 268,431 | |
Population Median Age | 39 | 36 | 37 | |
Population by Age | 0-9 Yrs | 2258 (14%) | 20919 (12%) | 33509 (12%) |
10-19 Yrs | 1557 (10%) | 23213 (14%) | 37837 (14%) | |
20-29 Yrs | 1813 (11%) | 28020 (17%) | 39502 (14%) | |
30-39 Yrs | 2466 (16%) | 22960 (14%) | 37126 (13%) | |
40-49 Yrs | 2088 (13%) | 20666 (12%) | 36940 (13%) | |
50-59 Yrs | 1949 (12%) | 18340 (11%) | 33332 (12%) | |
60-69 Yrs | 1522 (9%) | 13861 (8%) | 24005 (8%) | |
70+ Yrs | 1718 (11%) | 14436 (8%) | 26179 (9%) | |
Median HH Income | $157,619 | $109,150 | $120,690 | |
Total Household Income | < 24K | 575 (9%) | 6701 (12%) | 10687 (11%) |
25-49K | 489 (7%) | 6936 (13%) | 10571 (11%) | |
50-74K | 529 (8%) | 6601 (12%) | 10069 (11%) | |
75-99K | 493 (8%) | 4492 (8%) | 7573 (8%) | |
100-199K | 1614 (26%) | 12648 (23%) | 22782 (25%) | |
200K+ | 2439 (39%) | 15360 (29%) | 28496 (31%) | |
Highest Education Level | No Diploma | 162 | 14268 | 20920 |
Diploma or GED | 550 | 13237 | 20648 | |
Some College | 957 | 12928 | 22648 | |
Assoc. Degree | 306 | 4535 | 8106 | |
Bachelors Degree | 3405 | 24777 | 44325 | |
Higher Degree | 5413 | 34237 | 61139 | |
Total Housing Units | 6,767 | 56,173 | 95,486 | |
--Owner-Occupied | 2,878 | 25,828 | 48,962 | |
--Renter-Occupied | 3,260 | 26,910 | 41,216 | |
Owner-Occupied Values | < 100K | 46 | 543 | 1125 |
100-199K | 13 | 262 | 742 | |
200-299K | 12 | 290 | 510 | |
300-399K | 7 | 442 | 634 | |
400-499K | 21 | 513 | 727 | |
500K+ | 2778 | 23778 | 45224 | |
Total Working Age Population | 12,152 | 129,303 | 213,339 | |
In Work Force | 8,247 | 83,823 | 139,802 | |
Not In Work Force | 3,905 | 45,480 | 73,536 | |
Workforce Employed | 7,962 | 80,280 | 134,327 | |
Workforce Unemployed | 237 | 3,457 | 5,378 | |
Civlian Workforce | 8,199 | 83,737 | 139,705 | |
Military Workforce | 48 | 86 | 97 | |
Total Households | 6,138 | 52,738 | 90,178 | |
Family Households | 3,666 | 34,409 | 60,799 | |
Non-Family Households | 2,472 | 18,329 | 29,379 | |
Married Couple | 3,145 | 26,874 | 48,559 | |
Other Family | 521 | 7,536 | 12,240 | |
Married w/Child | 1,676 | 13,419 | 23,856 | |
Single Male w/Child | 77 | 1,011 | 1,727 | |
Single Female w/Child | 170 | 2,724 | 4,338 |
Population Change Last Two Decades - Plus Projection
2000 | % | 2010 | % | 2020 | % | 2030 | |
---|---|---|---|---|---|---|---|
California | 33,871,648 | +10 | 37,253,956 | +9 | 40,467,295 | +8 | 43,631,295 |
Santa Clara County | 1,682,585 | +6 | 1,781,642 | +12 | 1,996,394 | +10 | 2,194,079 |
San Mateo County | 707,161 | +2 | 718,451 | +9 | 785,650 | +6 | 833,868 |
Total Working Age Population:
Total Households:
Total Working Age Population:
Total Households:
Total Working Age Population:
Total Households: