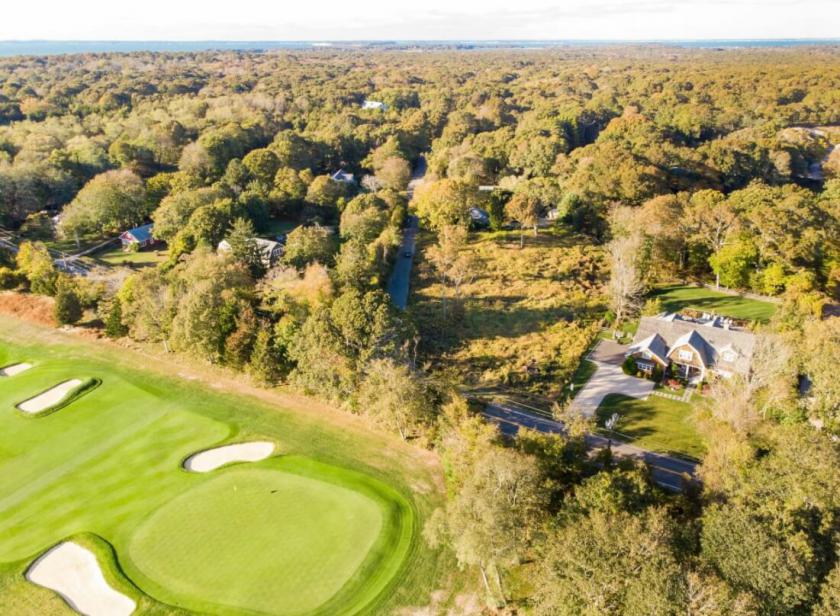
Commercial Land
New N Hwy Southampton, NY 11968
New N Hwy Southampton, NY 11968
Details & Description
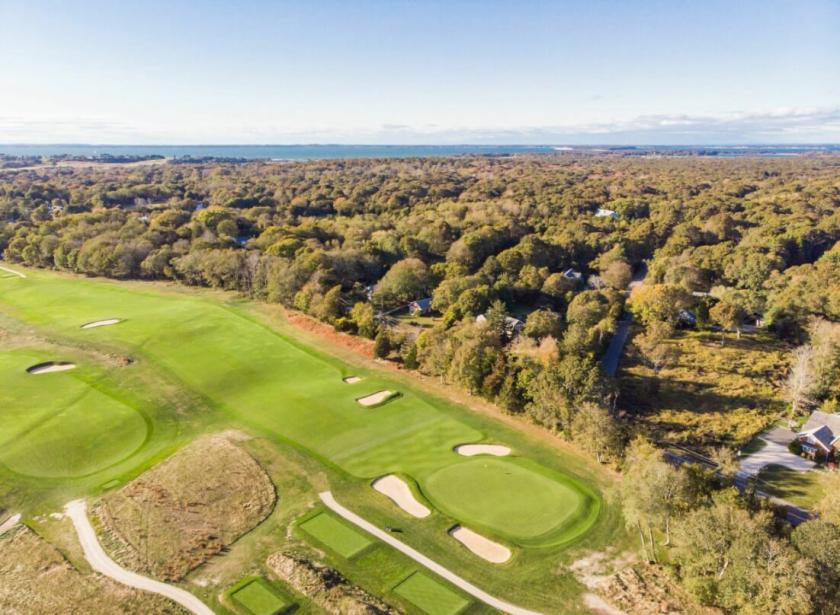
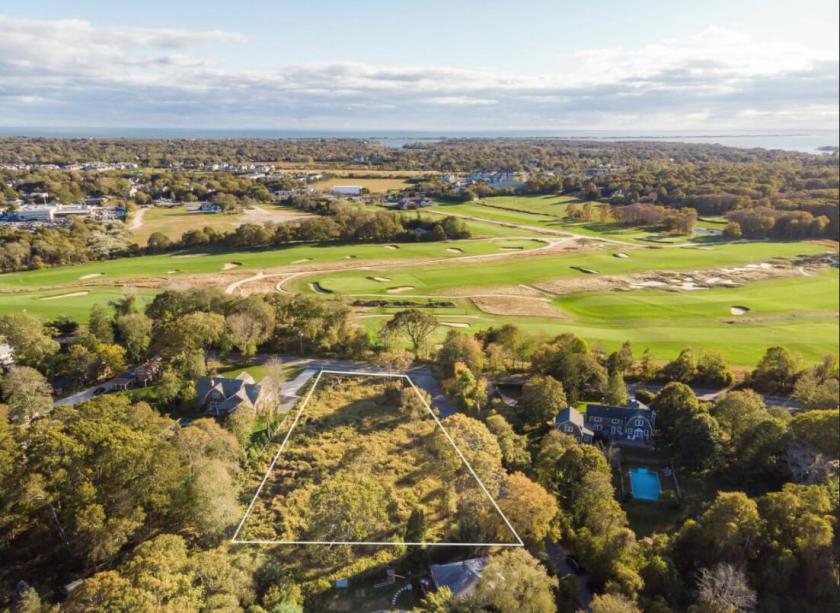
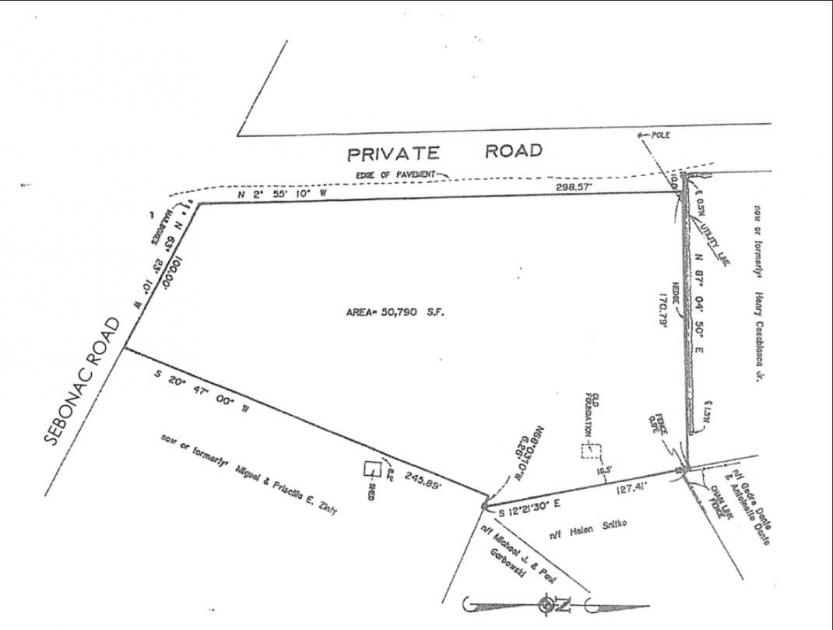
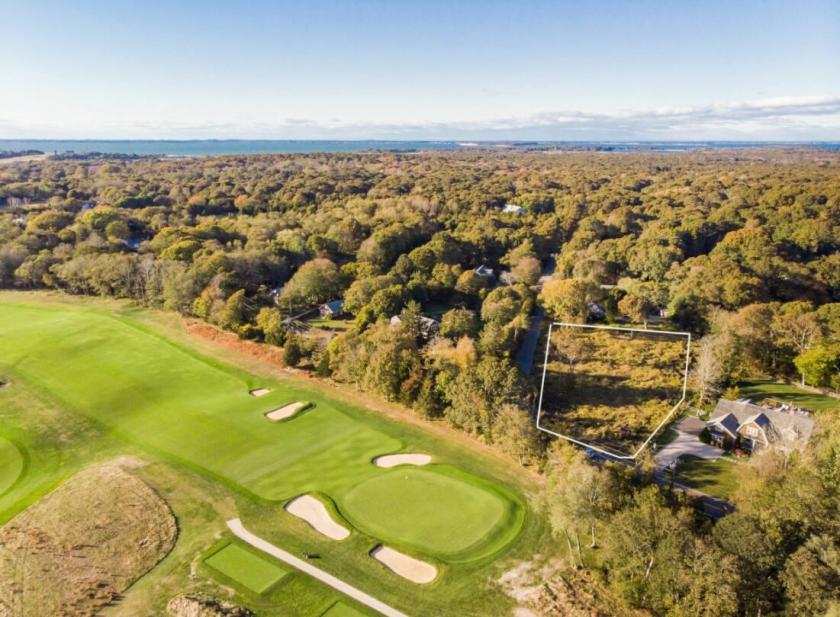
Additional Photos

Listing Agents

Silvia Bolatti
O: 631-287-9260
M: 646-645-3782
silviab@nestseekers.com
O: 631-287-9260
M: 646-645-3782
silviab@nestseekers.com
While we strive to provide the most accurate information, all listing information, and demographic data, is provided by third-parties. As such, MyEListing will not be responsible for the accuracy of the information. It is strongly recommended that you verify all information with the listing agent, and any relevant agencies, prior to making any decisions.