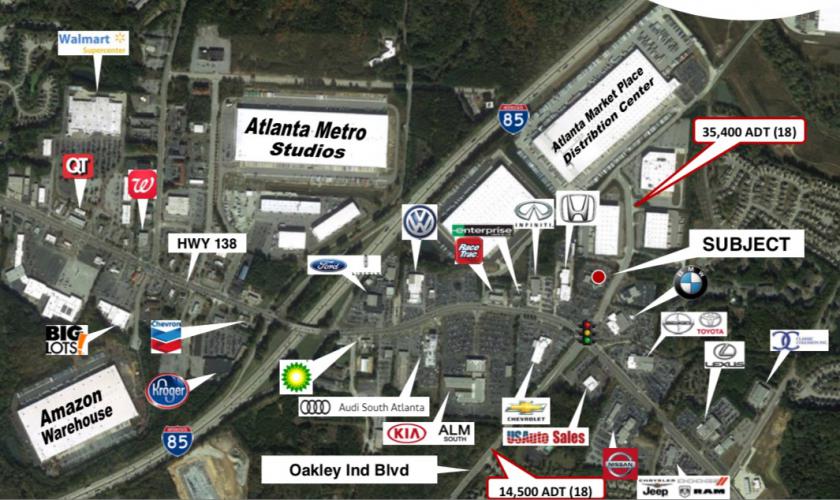
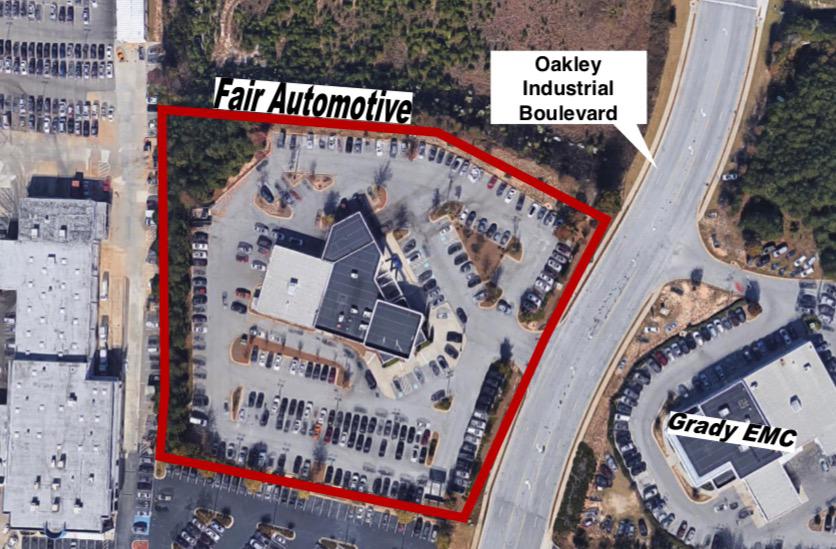
1-Mile | 3-Miles | 5-Miles | ||
---|---|---|---|---|
Total Population | 6,370 | 41,702 | 99,191 | |
Population Median Age | 34 | 35 | 35 | |
Population by Age | 0-9 Yrs | 1381 (21%) | 6669 (15%) | 15213 (15%) |
10-19 Yrs | 500 (7%) | 5449 (13%) | 13670 (13%) | |
20-29 Yrs | 1280 (20%) | 7015 (16%) | 15096 (15%) | |
30-39 Yrs | 713 (11%) | 5874 (14%) | 13905 (14%) | |
40-49 Yrs | 703 (11%) | 5457 (13%) | 13890 (14%) | |
50-59 Yrs | 477 (7%) | 4089 (9%) | 11121 (11%) | |
60-69 Yrs | 817 (12%) | 4488 (10%) | 10049 (10%) | |
70+ Yrs | 499 (7%) | 2661 (6%) | 6247 (6%) | |
Median HH Income | $39,243 | $43,657 | $46,685 | |
Total Household Income | < 24K | 740 (29%) | 4034 (27%) | 8707 (25%) |
25-49K | 788 (31%) | 4441 (30%) | 9862 (28%) | |
50-74K | 576 (22%) | 2727 (18%) | 6494 (18%) | |
75-99K | 208 (8%) | 1504 (10%) | 3892 (11%) | |
100-199K | 217 (8%) | 1893 (12%) | 4849 (14%) | |
200K+ | 2 (0%) | 113 (0%) | 617 (1%) | |
Highest Education Level | No Diploma | 302 | 2275 | 6140 |
Diploma or GED | 1134 | 8375 | 19420 | |
Some College | 936 | 6055 | 14015 | |
Assoc. Degree | 662 | 3003 | 6147 | |
Bachelors Degree | 663 | 4425 | 10633 | |
Higher Degree | 263 | 2004 | 5713 | |
Total Housing Units | 2,858 | 16,849 | 40,590 | |
--Owner-Occupied | 759 | 7,325 | 19,148 | |
--Renter-Occupied | 1,772 | 7,386 | 15,273 | |
Owner-Occupied Values | < 100K | 336 | 2720 | 6757 |
100-199K | 399 | 4001 | 9220 | |
200-299K | 8 | 393 | 1832 | |
300-399K | 0 | 72 | 702 | |
400-499K | 16 | 90 | 330 | |
500K+ | 1 | 48 | 308 | |
Total Working Age Population | 4,729 | 31,406 | 75,141 | |
In Work Force | 3,009 | 20,781 | 49,874 | |
Not In Work Force | 1,720 | 10,626 | 25,267 | |
Workforce Employed | 2,778 | 18,896 | 45,341 | |
Workforce Unemployed | 203 | 1,802 | 4,372 | |
Civlian Workforce | 2,981 | 20,698 | 49,712 | |
Military Workforce | 28 | 82 | 162 | |
Total Households | 2,531 | 14,711 | 34,421 | |
Family Households | 1,439 | 9,094 | 21,937 | |
Non-Family Households | 1,092 | 5,617 | 12,484 | |
Married Couple | 554 | 4,288 | 10,677 | |
Other Family | 885 | 4,806 | 11,260 | |
Married w/Child | 249 | 1,769 | 4,472 | |
Single Male w/Child | 264 | 597 | 1,138 | |
Single Female w/Child | 249 | 2,211 | 5,141 |
Population Change Last Two Decades - Plus Projection
2000 | % | 2010 | % | 2020 | % | 2030 | |
---|---|---|---|---|---|---|---|
Georgia | 8,186,453 | +18 | 9,687,653 | +10 | 10,694,980 | +9 | 11,709,700 |
Fulton County | 816,006 | +13 | 920,581 | +17 | 1,074,154 | +11 | 1,186,980 |
Clayton County | 236,517 | +10 | 259,424 | +15 | 299,477 | +17 | 349,752 |
Fayette County | 91,263 | +17 | 106,567 | +7 | 114,550 | +9 | 124,620 |
Total Working Age Population:
Total Households:
Total Working Age Population:
Total Households:
Total Working Age Population:
Total Households: