Retail Space
4704 Cahaba River Rd Birmingham, AL 35243
4704 Cahaba River Rd Birmingham, AL 35243
Details & Description
Property Highlights
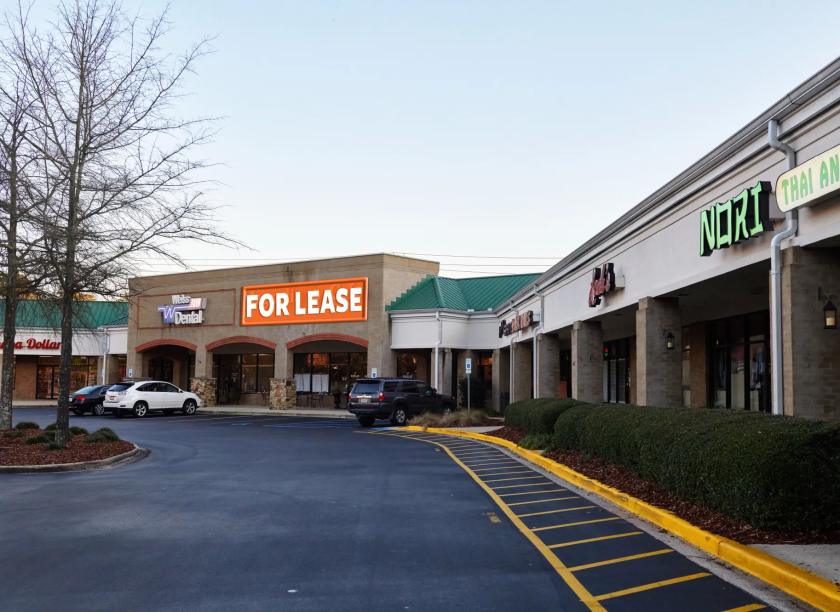
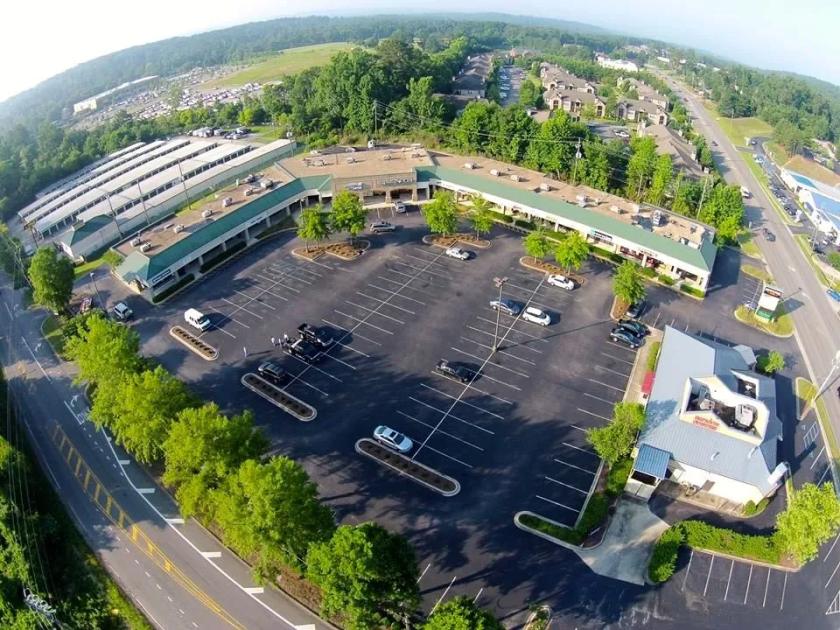
- • Ample and convenient parking
- • Includes Prominent Monument signage
- • Strong, diverse tenant mix with longevity
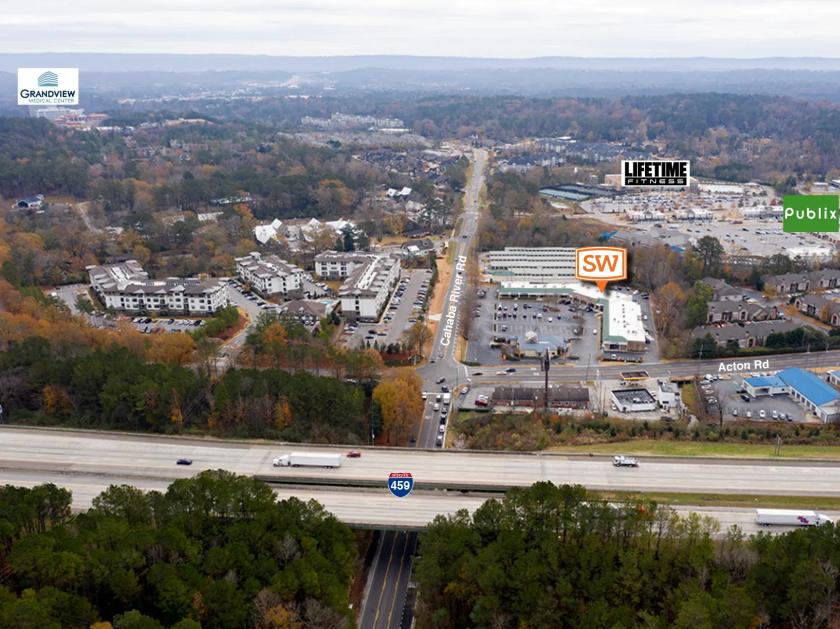
- • Easy access to Highway 280 & I-459
Additional Photos


Listing Agents

Anna Kate Teal
O: 205-977-9909
akt@shanwalt.com
O: 205-977-9909
akt@shanwalt.com
While we strive to provide the most accurate information, all listing information, and demographic data, is provided by third-parties. As such, MyEListing will not be responsible for the accuracy of the information. It is strongly recommended that you verify all information with the listing agent, and any relevant agencies, prior to making any decisions.