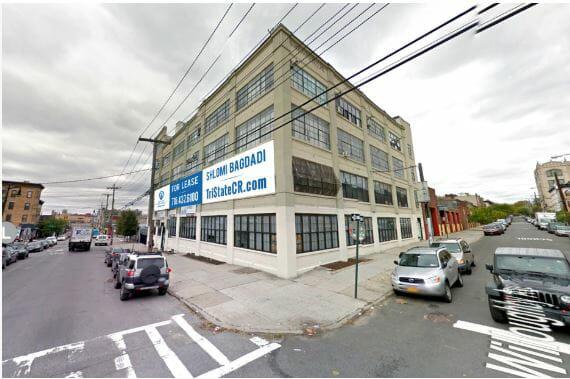
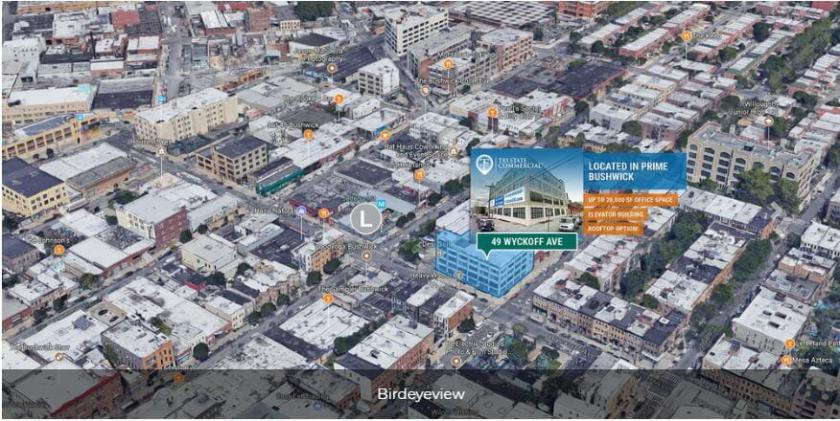
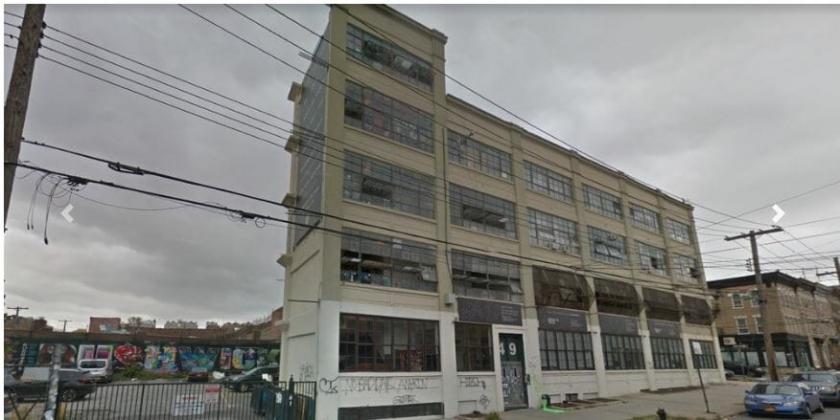
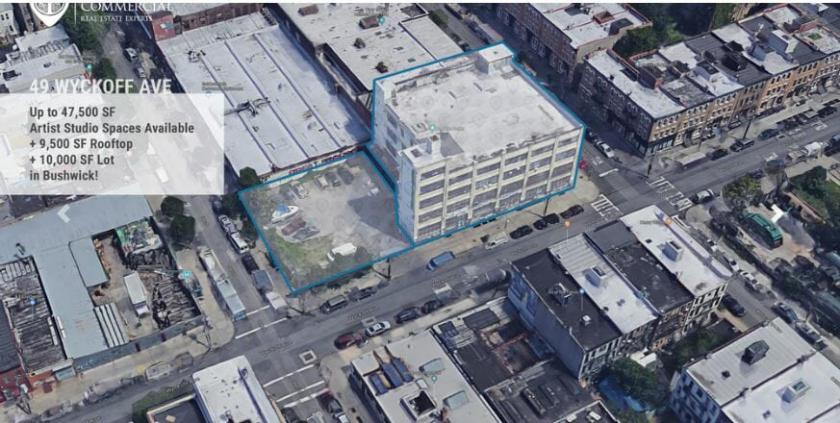
1-Mile | 3-Miles | 5-Miles | ||
---|---|---|---|---|
Total Population | 131,775 | 1,020,477 | 3,164,828 | |
Population Median Age | 34 | 36 | 38 | |
Population by Age | 0-9 Yrs | 16025 (12%) | 131900 (12%) | 362938 (11%) |
10-19 Yrs | 14529 (11%) | 111764 (10%) | 308122 (9%) | |
20-29 Yrs | 31736 (24%) | 192311 (18%) | 555813 (17%) | |
30-39 Yrs | 25064 (19%) | 185315 (18%) | 574000 (18%) | |
40-49 Yrs | 15336 (11%) | 127939 (12%) | 415200 (13%) | |
50-59 Yrs | 13008 (9%) | 114973 (11%) | 370235 (11%) | |
60-69 Yrs | 8396 (6%) | 83452 (8%) | 298731 (9%) | |
70+ Yrs | 7682 (5%) | 72823 (7%) | 279789 (8%) | |
Median HH Income | $53,882 | $55,800 | $67,713 | |
Total Household Income | < 24K | 12267 (27%) | 100945 (26%) | 279125 (22%) |
25-49K | 9240 (20%) | 74616 (19%) | 222489 (17%) | |
50-74K | 6649 (14%) | 56486 (14%) | 180196 (14%) | |
75-99K | 5268 (11%) | 42985 (11%) | 139573 (11%) | |
100-199K | 9871 (21%) | 78032 (20%) | 280481 (22%) | |
200K+ | 1847 (4%) | 26501 (6%) | 161289 (12%) | |
Highest Education Level | No Diploma | 22966 | 131300 | 356482 |
Diploma or GED | 22406 | 187352 | 517928 | |
Some College | 12605 | 99344 | 279978 | |
Assoc. Degree | 4192 | 42736 | 127834 | |
Bachelors Degree | 18806 | 158318 | 586911 | |
Higher Degree | 6805 | 81838 | 410172 | |
Total Housing Units | 48,723 | 416,872 | 1,417,202 | |
--Owner-Occupied | 6,630 | 88,235 | 358,188 | |
--Renter-Occupied | 38,513 | 291,329 | 904,965 | |
Owner-Occupied Values | < 100K | 367 | 3783 | 12368 |
100-199K | 145 | 2513 | 15280 | |
200-299K | 387 | 4412 | 23018 | |
300-399K | 437 | 5900 | 33006 | |
400-499K | 910 | 8832 | 40370 | |
500K+ | 4385 | 62794 | 234146 | |
Total Working Age Population | 106,812 | 820,431 | 2,617,406 | |
In Work Force | 73,696 | 540,695 | 1,745,098 | |
Not In Work Force | 33,116 | 279,737 | 872,308 | |
Workforce Employed | 68,327 | 503,957 | 1,641,503 | |
Workforce Unemployed | 5,369 | 36,568 | 102,868 | |
Civlian Workforce | 73,696 | 540,525 | 1,744,371 | |
Military Workforce | 0 | 170 | 727 | |
Total Households | 45,142 | 379,564 | 1,263,154 | |
Family Households | 25,684 | 214,642 | 674,450 | |
Non-Family Households | 19,459 | 164,922 | 588,703 | |
Married Couple | 13,362 | 121,045 | 423,050 | |
Other Family | 12,322 | 93,597 | 251,400 | |
Married w/Child | 6,314 | 54,677 | 176,974 | |
Single Male w/Child | 1,262 | 7,367 | 20,154 | |
Single Female w/Child | 4,250 | 31,774 | 80,103 |
Population Change Last Two Decades - Plus Projection
2000 | % | 2010 | % | 2020 | % | 2030 | |
---|---|---|---|---|---|---|---|
New York | 18,976,457 | +2 | 19,378,102 | +4 | 20,146,131 | +2 | 20,604,030 |
Kings County | 2,465,326 | +2 | 2,504,700 | +9 | 2,738,283 | +5 | 2,863,996 |
Queens County | 2,229,379 | 0 | 2,230,722 | +9 | 2,436,549 | +5 | 2,565,268 |
New York County | 1,537,195 | +3 | 1,585,873 | +6 | 1,688,894 | +2 | 1,727,631 |
Total Working Age Population:
Total Households:
Total Working Age Population:
Total Households:
Total Working Age Population:
Total Households: