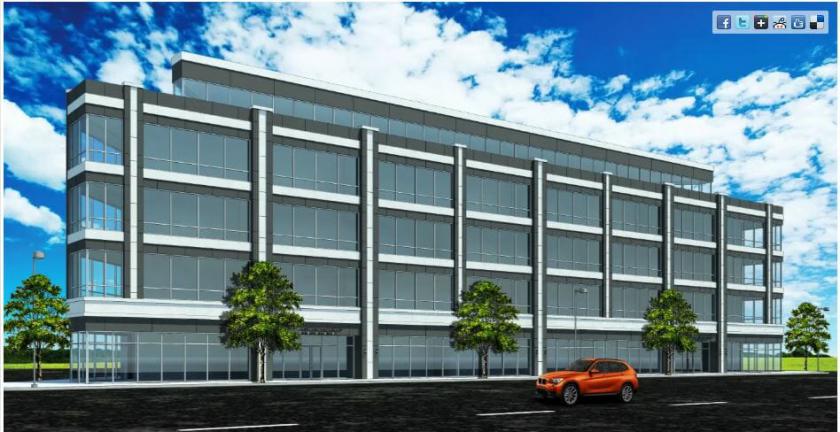
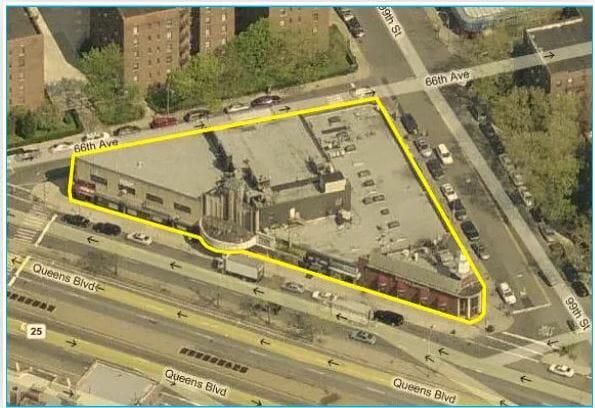
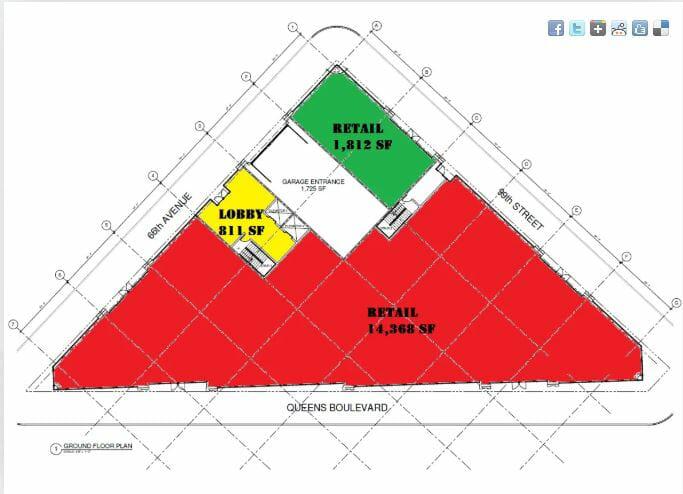
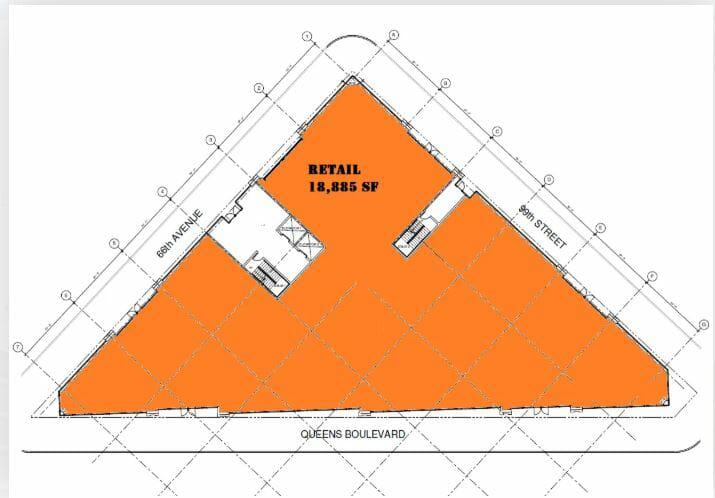
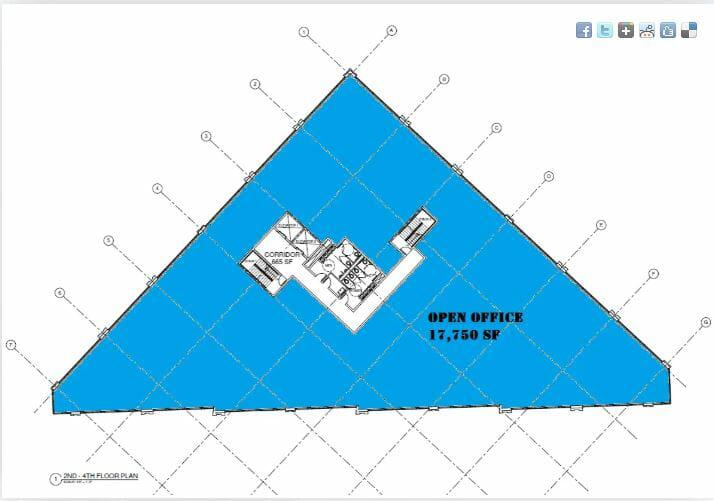
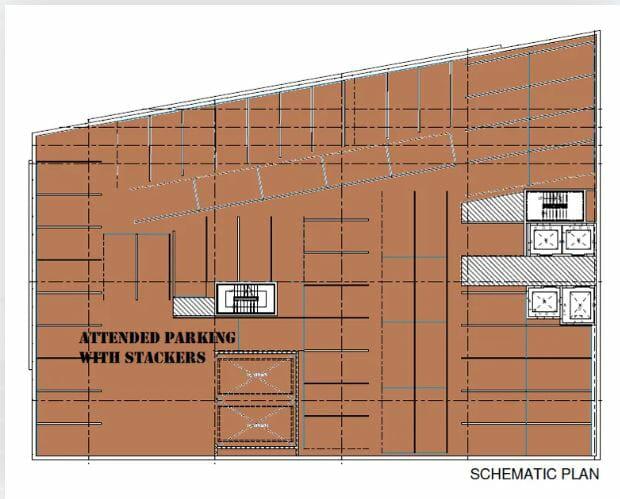
1-Mile | 3-Miles | 5-Miles | ||
---|---|---|---|---|
Total Population | 141,641 | 933,433 | 2,159,614 | |
Population Median Age | 42 | 39 | 38 | |
Population by Age | 0-9 Yrs | 16624 (11%) | 115262 (12%) | 253345 (11%) |
10-19 Yrs | 11590 (8%) | 94770 (10%) | 227762 (10%) | |
20-29 Yrs | 17325 (12%) | 129626 (13%) | 345954 (16%) | |
30-39 Yrs | 21858 (15%) | 147756 (15%) | 349314 (16%) | |
40-49 Yrs | 18903 (13%) | 132148 (14%) | 291221 (13%) | |
50-59 Yrs | 19451 (13%) | 123849 (13%) | 282601 (13%) | |
60-69 Yrs | 17564 (12%) | 98778 (10%) | 214493 (9%) | |
70+ Yrs | 18326 (12%) | 91243 (9%) | 194923 (9%) | |
Median HH Income | $65,389 | $60,658 | $59,521 | |
Total Household Income | < 24K | 12181 (20%) | 64334 (20%) | 163598 (22%) |
25-49K | 11074 (18%) | 69174 (21%) | 156904 (21%) | |
50-74K | 9526 (16%) | 56207 (17%) | 125852 (16%) | |
75-99K | 7773 (13%) | 40524 (12%) | 92520 (12%) | |
100-199K | 13797 (23%) | 69210 (21%) | 160721 (21%) | |
200K+ | 4072 (6%) | 17467 (5%) | 42130 (5%) | |
Highest Education Level | No Diploma | 13205 | 140018 | 313496 |
Diploma or GED | 21967 | 192083 | 438603 | |
Some College | 13917 | 86082 | 208766 | |
Assoc. Degree | 8078 | 50248 | 112892 | |
Bachelors Degree | 28808 | 126387 | 300860 | |
Higher Degree | 21239 | 73702 | 159302 | |
Total Housing Units | 62,816 | 347,846 | 817,732 | |
--Owner-Occupied | 23,145 | 123,750 | 268,327 | |
--Renter-Occupied | 35,278 | 193,167 | 473,398 | |
Owner-Occupied Values | < 100K | 736 | 4405 | 9337 |
100-199K | 2807 | 10460 | 18458 | |
200-299K | 5354 | 16225 | 26836 | |
300-399K | 3819 | 13589 | 31031 | |
400-499K | 1928 | 13904 | 35207 | |
500K+ | 8501 | 65167 | 147458 | |
Total Working Age Population | 117,384 | 758,814 | 1,767,594 | |
In Work Force | 74,599 | 486,770 | 1,132,030 | |
Not In Work Force | 42,785 | 272,044 | 635,564 | |
Workforce Employed | 70,964 | 460,422 | 1,059,224 | |
Workforce Unemployed | 3,625 | 26,151 | 72,387 | |
Civlian Workforce | 74,589 | 486,574 | 1,131,610 | |
Military Workforce | 10 | 196 | 420 | |
Total Households | 58,423 | 316,916 | 741,725 | |
Family Households | 34,795 | 214,630 | 484,190 | |
Non-Family Households | 23,628 | 102,286 | 257,535 | |
Married Couple | 24,355 | 146,764 | 311,224 | |
Other Family | 10,440 | 67,867 | 172,966 | |
Married w/Child | 9,337 | 64,355 | 131,676 | |
Single Male w/Child | 623 | 6,654 | 14,679 | |
Single Female w/Child | 2,591 | 17,627 | 50,315 |
Population Change Last Two Decades - Plus Projection
2000 | % | 2010 | % | 2020 | % | 2030 | |
---|---|---|---|---|---|---|---|
New York | 18,976,457 | +2 | 19,378,102 | +4 | 20,146,131 | +2 | 20,604,030 |
Kings County | 2,465,326 | +2 | 2,504,700 | +9 | 2,738,283 | +5 | 2,863,996 |
Queens County | 2,229,379 | 0 | 2,230,722 | +9 | 2,436,549 | +5 | 2,565,268 |
Bronx County | 1,332,650 | +4 | 1,385,108 | +10 | 1,519,809 | +6 | 1,604,168 |
Total Working Age Population:
Total Households:
Total Working Age Population:
Total Households:
Total Working Age Population:
Total Households: