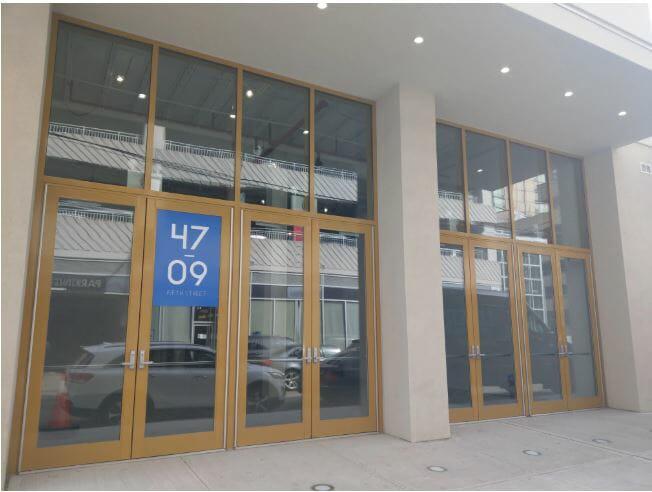
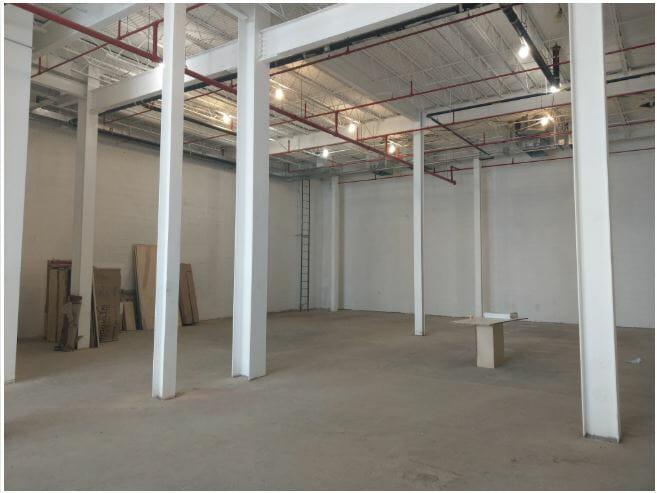
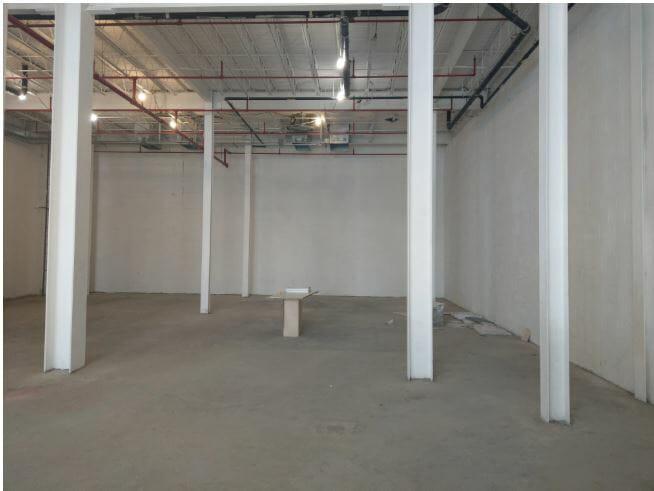
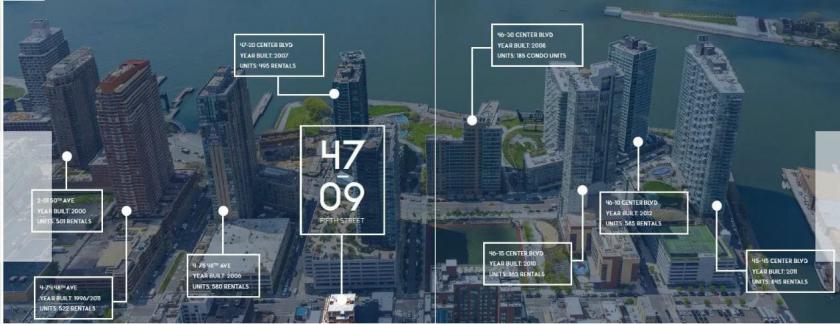
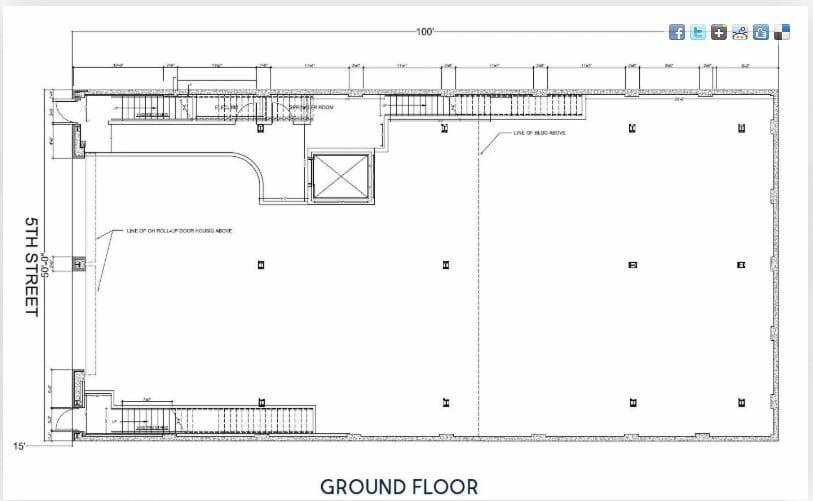
1-Mile | 3-Miles | 5-Miles | ||
---|---|---|---|---|
Total Population | 82,537 | 1,256,562 | 3,076,531 | |
Population Median Age | 41 | 40 | 38 | |
Population by Age | 0-9 Yrs | 7464 (9%) | 105204 (8%) | 321004 (10%) |
10-19 Yrs | 3913 (4%) | 85342 (6%) | 268123 (8%) | |
20-29 Yrs | 15889 (19%) | 243170 (19%) | 567657 (18%) | |
30-39 Yrs | 17454 (21%) | 261604 (20%) | 597059 (19%) | |
40-49 Yrs | 10338 (12%) | 159459 (12%) | 401868 (13%) | |
50-59 Yrs | 9020 (10%) | 140949 (11%) | 351965 (11%) | |
60-69 Yrs | 8410 (10%) | 126335 (10%) | 286042 (9%) | |
70+ Yrs | 10049 (12%) | 134499 (10%) | 282813 (9%) | |
Median HH Income | $114,999 | $92,525 | $75,998 | |
Total Household Income | < 24K | 6461 (15%) | 110464 (17%) | 277046 (21%) |
25-49K | 4148 (9%) | 80214 (13%) | 204362 (15%) | |
50-74K | 4563 (10%) | 73659 (11%) | 169643 (12%) | |
75-99K | 3850 (9%) | 62409 (10%) | 135130 (10%) | |
100-199K | 11888 (28%) | 152529 (24%) | 300642 (22%) | |
200K+ | 11543 (27%) | 136906 (22%) | 226074 (17%) | |
Highest Education Level | No Diploma | 3797 | 93855 | 331002 |
Diploma or GED | 6856 | 123149 | 412903 | |
Some College | 5987 | 85364 | 239078 | |
Assoc. Degree | 2215 | 39399 | 105057 | |
Bachelors Degree | 24830 | 349447 | 662415 | |
Higher Degree | 23032 | 295109 | 527865 | |
Total Housing Units | 52,587 | 719,835 | 1,493,913 | |
--Owner-Occupied | 13,851 | 163,498 | 344,588 | |
--Renter-Occupied | 28,601 | 452,683 | 968,309 | |
Owner-Occupied Values | < 100K | 112 | 5815 | 11654 |
100-199K | 201 | 4073 | 12686 | |
200-299K | 536 | 5233 | 18788 | |
300-399K | 525 | 7847 | 23181 | |
400-499K | 1276 | 11251 | 27186 | |
500K+ | 11202 | 129279 | 251093 | |
Total Working Age Population | 72,611 | 1,103,891 | 2,598,671 | |
In Work Force | 52,651 | 774,324 | 1,764,602 | |
Not In Work Force | 19,960 | 329,567 | 834,069 | |
Workforce Employed | 50,104 | 738,497 | 1,668,394 | |
Workforce Unemployed | 2,537 | 35,446 | 95,483 | |
Civlian Workforce | 52,641 | 773,942 | 1,763,876 | |
Military Workforce | 10 | 382 | 726 | |
Total Households | 42,452 | 616,181 | 1,312,896 | |
Family Households | 18,185 | 248,394 | 638,293 | |
Non-Family Households | 24,268 | 367,788 | 674,603 | |
Married Couple | 14,416 | 189,302 | 427,489 | |
Other Family | 3,769 | 59,092 | 210,804 | |
Married w/Child | 4,417 | 66,312 | 173,115 | |
Single Male w/Child | 201 | 4,974 | 18,117 | |
Single Female w/Child | 1,308 | 17,027 | 67,286 |
Population Change Last Two Decades - Plus Projection
2000 | % | 2010 | % | 2020 | % | 2030 | |
---|---|---|---|---|---|---|---|
New York | 18,976,457 | +2 | 19,378,102 | +4 | 20,146,131 | +2 | 20,604,030 |
Kings County | 2,465,326 | +2 | 2,504,700 | +9 | 2,738,283 | +5 | 2,863,996 |
Queens County | 2,229,379 | 0 | 2,230,722 | +9 | 2,436,549 | +5 | 2,565,268 |
New York County | 1,537,195 | +3 | 1,585,873 | +6 | 1,688,894 | +2 | 1,727,631 |
Bronx County | 1,332,650 | +4 | 1,385,108 | +10 | 1,519,809 | +6 | 1,604,168 |
New Jersey | 8,414,350 | +4 | 8,791,894 | +4 | 9,132,700 | +4 | 9,530,900 |
Bergen County | 884,118 | +2 | 905,116 | +7 | 967,500 | +7 | 1,031,500 |
Hudson County | 608,975 | +4 | 634,266 | +12 | 708,100 | +6 | 747,400 |
Total Working Age Population:
Total Households:
Total Working Age Population:
Total Households:
Total Working Age Population:
Total Households: